Introduction to Photoelectric Sensor Experimentation
Photoelectric sensors are fundamental components in modern industrial automation, playing a critical role in object detection, positioning, and counting. Processing an experiment report for these sensors is not merely an academic exercise; it is a practical skill that bridges theoretical knowledge with real-world application. A well-structured report serves as a definitive record of sensor performance, environmental interactions, and potential limitations. For engineers, mastering this process ensures accurate system integration, reliable troubleshooting, and informed decision-making for specific automation tasks. The core objective is to transform raw experimental data into actionable intelligence, documenting the sensor's behavior under controlled and variable conditions to validate its suitability for intended operational environments.
Essential Components of the Experiment Report
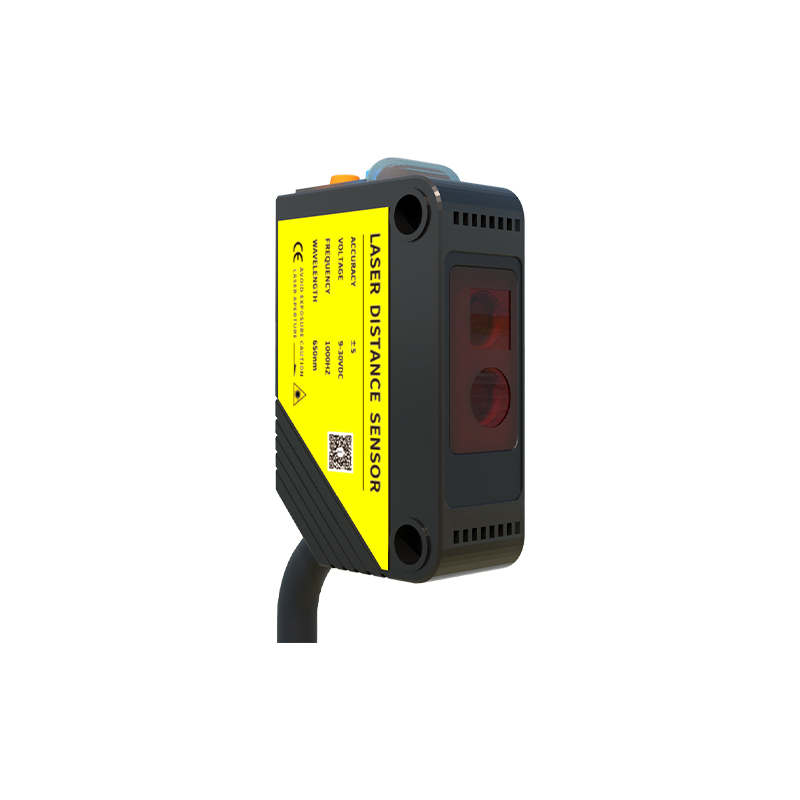
A comprehensive photoelectric sensor experiment report must be methodical and detailed. It begins with a clear statement of the experiment's objectives, such as determining the effective sensing range, evaluating response time under different surface reflectivities, or testing immunity to ambient light interference. The apparatus section must list all equipment with precise specifications: the photoelectric sensor model (diffuse, retro-reflective, or through-beam), light source type (typically LED with specified wavelength), power supply details, target objects of various materials and colors, measuring instruments like oscilloscopes for timing, and distance gauges. The experimental procedure should be a step-by-step, reproducible protocol, detailing the setup geometry, environmental controls, and the sequence of measurements taken.
Data Collection and Measurement Protocols
Accurate data collection is the cornerstone of a reliable report. Engineers must establish a rigorous protocol. Key measurements include the actual sensing distance versus the datasheet specification for different target types. Response time should be measured from the moment the target interrupts the beam to the output signal transition, using an oscilloscope for precision. The experiment must quantify the sensor's performance with targets of varying reflectivity (e.g., white paper, black rubber, metallic surfaces) and under different ambient light conditions. Data should be recorded in tabular format, noting any anomalies. Multiple trials are essential to calculate average values and standard deviations, providing a statistical basis for the findings and highlighting repeatability.
Analysis of Experimental Results
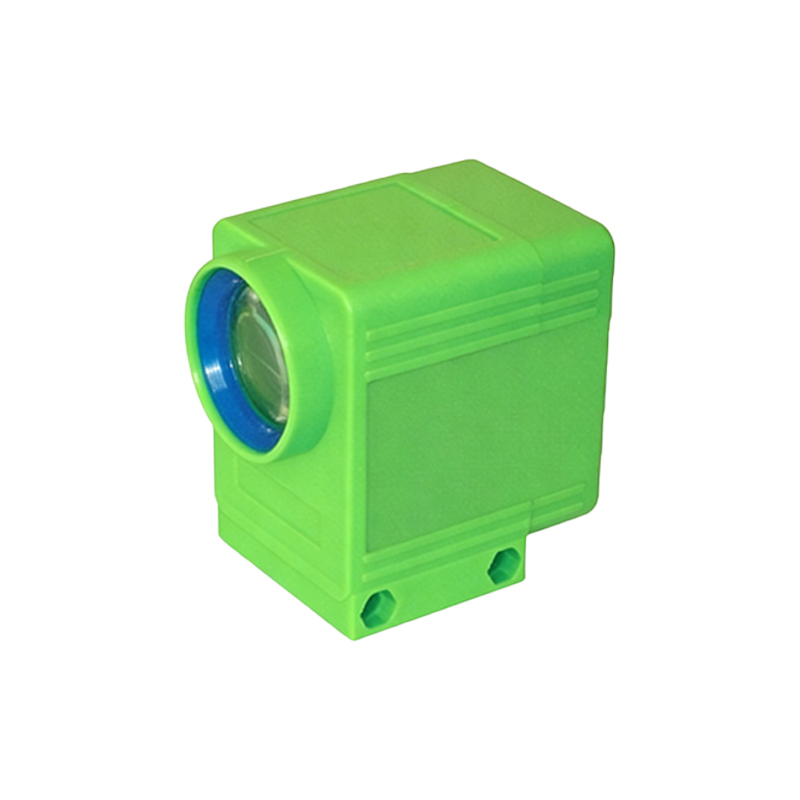
The analysis section interprets the collected data, moving beyond raw numbers to meaningful conclusions. Graphs are highly effective here: a plot of sensing distance versus target reflectivity, or response time versus supply voltage. The analysis should compare experimental results with the manufacturer's datasheet parameters, explaining any discrepancies. For instance, if the effective sensing range for a black object is 30% less than advertised, this must be noted and reasoned—perhaps due to the specific angle of incidence or surface texture. The impact of external factors, such as dust on the lens or humidity, should also be evaluated if tested. This section answers the "why" behind the data, assessing the sensor's strengths and limitations.
Error Identification and Troubleshooting
No experiment is perfect, and a professional report honestly addresses errors and inconsistencies. This section details potential sources of error, such as parallax error in distance measurement, slight fluctuations in power supply voltage, or unaccounted-for infrared interference from other equipment. It should also document any troubleshooting performed during the experiment. For example, if the sensor provided erratic readings, the report should note the steps taken: cleaning the lens, checking alignment, shielding from ambient light, or verifying cable connections. Documenting this process is invaluable for future reference and demonstrates rigorous experimental practice.
Compiling the Final Report Document
The final compilation synthesizes all elements into a coherent, professional document. Use clear headings, consistent units (millimeters, milliseconds, lux), and labeled figures/diagrams. The discussion should summarize key findings: "The through-beam sensor demonstrated a consistent 5ms response time, unaffected by target color, but required precise alignment." Conclusions must directly address the initial objectives, stating whether the sensor meets the requirements for a proposed application. Finally, provide recommendations. These could be for optimal operating conditions, suggestions for alternative sensor types if the tested one is unsuitable, or proposals for further experiments to explore uncovered questions. Appendices may include raw data tables and detailed circuit diagrams.
Practical Applications and Industry Implications
The ultimate value of the experiment report lies in its application. A properly processed report directly informs design choices in conveyor belt systems, packaging machinery, robotic pick-and-place cells, and safety light curtains. It allows engineers to specify sensors with confidence, knowing their exact performance boundaries. In quality control and maintenance, these reports serve as benchmarks; performance degradation over time can be spotted by comparing new data with the original experiment. Sharing standardized reports within a team or across an organization fosters knowledge transfer, reduces integration errors, and accelerates the development of robust automated systems, ensuring efficiency and reliability on the factory floor.