Introduction to Proximity Sensor Fundamentals
Proximity sensors are non-contact electronic devices designed to detect the presence or absence of an object within a specified sensing range. Unlike mechanical limit switches, they operate without physical contact, making them ideal for harsh environments, high-speed applications, and scenarios requiring high reliability and long operational life. The core principle involves generating an electromagnetic field or a beam of radiation and monitoring for changes caused by a target object. The schematic diagram of a proximity sensor is the roadmap that details its internal electronic circuitry, component interactions, and signal flow, providing engineers with critical insights for selection, integration, and troubleshooting.
Decoding the Core Components in the Schematic
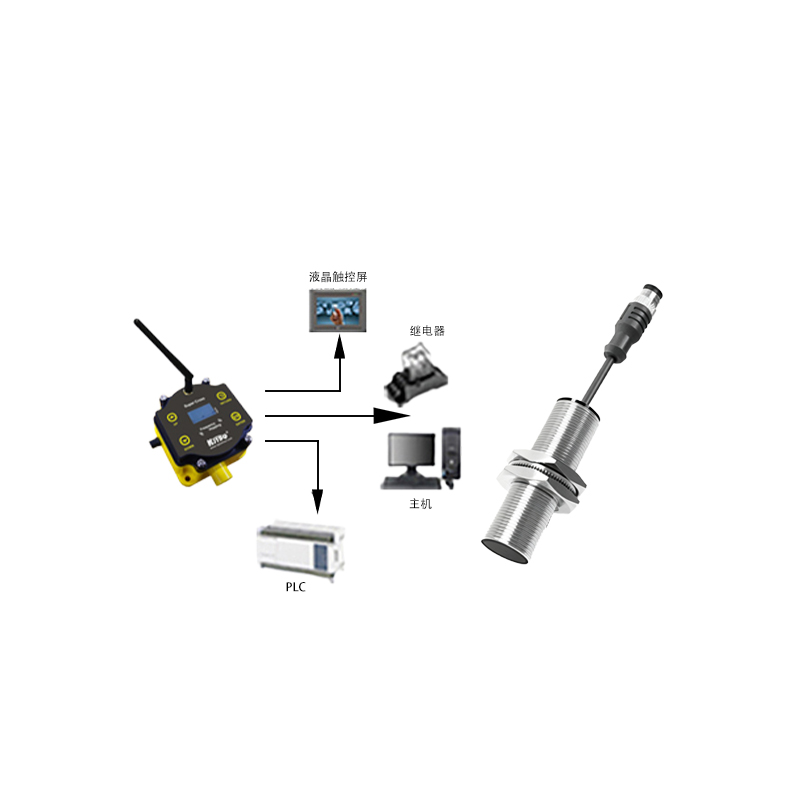
A standard proximity sensor schematic, particularly for inductive or capacitive types, reveals several key functional blocks. The oscillator circuit is the heart, typically centered around a coil (for inductive) or electrode plates (for capacitive). This circuit generates a high-frequency electromagnetic field at the sensing face. The detection circuit continuously monitors the amplitude of this oscillation. When a metallic target (for inductive) or any material (for capacitive) enters the field, it causes energy absorption or a change in capacitance, leading to a dampening or shift in the oscillation amplitude. This minute change is fed into an amplifier circuit, which boosts the signal to a usable level for further processing.
Signal Processing and Output Stage Analysis
Following amplification, the signal proceeds to the threshold detector or comparator. This stage compares the processed signal against a predefined reference voltage. If the signal strength exceeds this threshold—indicating a target is present—the comparator triggers a change in state. This trigger then drives the output stage. The output stage schematic shows the final switching component, which could be an NPN or PNP transistor, a MOSFET, or a relay. For a 3-wire DC sensor, the schematic clearly depicts how this switching element connects to the supply voltage (Vcc), ground, and the output load. Protection components like flyback diodes (for inductive loads), current-limiting resistors, and surge protection devices are also clearly illustrated to ensure durability.
Inductive vs. Capacitive Sensor Schematics
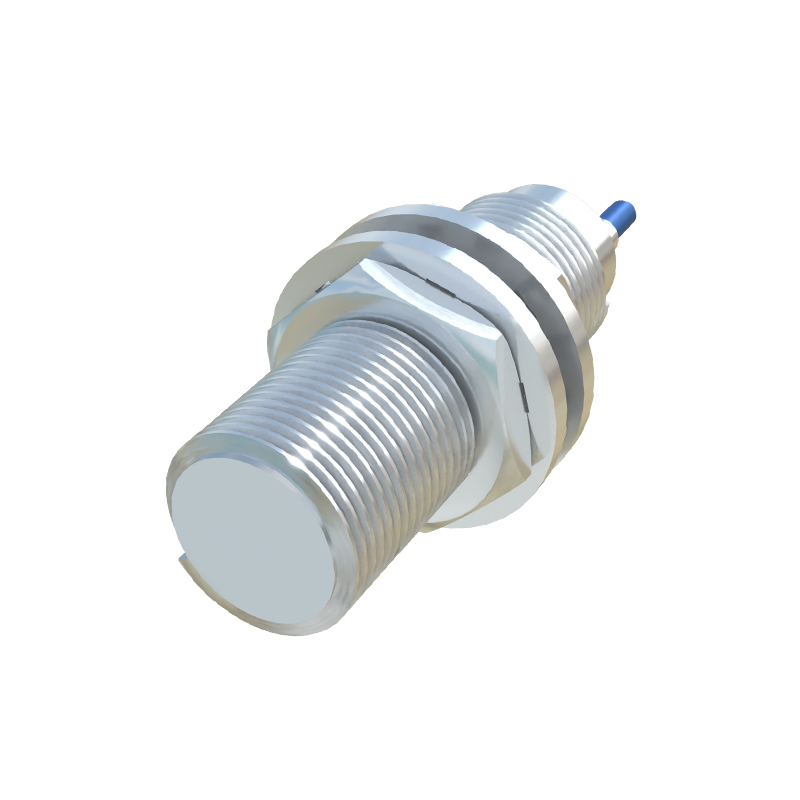
While the block diagrams are similar, key differences exist in the front-end circuitry on schematics. An inductive proximity sensor schematic prominently features a ferrite core coil as part of the LC tank oscillator. Its operation relies on eddy currents induced in metallic targets. In contrast, a capacitive sensor schematic shows an open capacitor arrangement formed by the sensor electrode and a ground electrode (or the target itself). The oscillator frequency in a capacitive sensor is highly sensitive to dielectric changes. Analyzing these schematic differences is crucial for engineers to select the correct sensor for the application, whether it's detecting metals (inductive) or non-metals like liquids, plastics, or granular materials (capacitive).

Wiring and Interface Diagrams
A comprehensive schematic or accompanying wiring diagram details the external connections. For a 3-wire DC sensor, this includes the Brown wire (V+), Blue wire (0V/GND), and Black wire (load output). The schematic shows the internal connection of these wires to the circuitry, clarifying the sinking (NPN) or sourcing (PNP) configuration. For 2-wire AC/DC sensors, the schematic demonstrates how the sensor is connected in series with the load. For 4-wire sensors (with two outputs), the diagram illustrates the independent or complementary switching logic. Understanding this part of the schematic is essential for correctly integrating the sensor into a control panel, PLC input module, or directly with a relay or contactor.
Key Parameters Illustrated in the Design
A well-drawn schematic allows engineers to infer critical operational parameters. The design of the oscillator coil or electrodes relates directly to the nominal sensing distance (Sn). The hysteresis, or the difference between the switch-on and switch-off points, is determined by the feedback in the comparator circuit. The switching frequency capability is influenced by the speed of the oscillator, amplifier, and output transistor. Furthermore, protection circuits shown on the schematic, such as reverse polarity protection, short-circuit protection, and overload clamping, directly inform the sensor's robustness and compliance with industry standards like IEC 60947-5-2.
Practical Troubleshooting Using the Schematic
The schematic diagram is an indispensable tool for field troubleshooting. If a sensor fails to detect a target, an engineer can trace the signal path. Using a multimeter or oscilloscope, one can check for the presence of the high-frequency oscillation at the coil, verify the amplified signal level before the comparator, and test the switching state of the output transistor. A lack of oscillation might indicate a damaged coil or faulty oscillator component. A correct signal before the comparator but no output change points to