Introduction to Capacitive Sensing Technology
A capacitive proximity sensor operates on the principle of capacitance change. Unlike inductive sensors that detect metallic objects, capacitive sensors can detect a wide range of materials, including liquids, powders, plastics, and wood. The core component is an electrode, often part of an RC oscillator circuit. When an object enters the sensor's electrostatic field, it alters the dielectric constant and thus the capacitance of the system. This change in capacitance is measured and converted into a switching signal. The fundamental advantage lies in its versatility for non-metallic object detection, making it indispensable in packaging, food processing, and material handling industries.
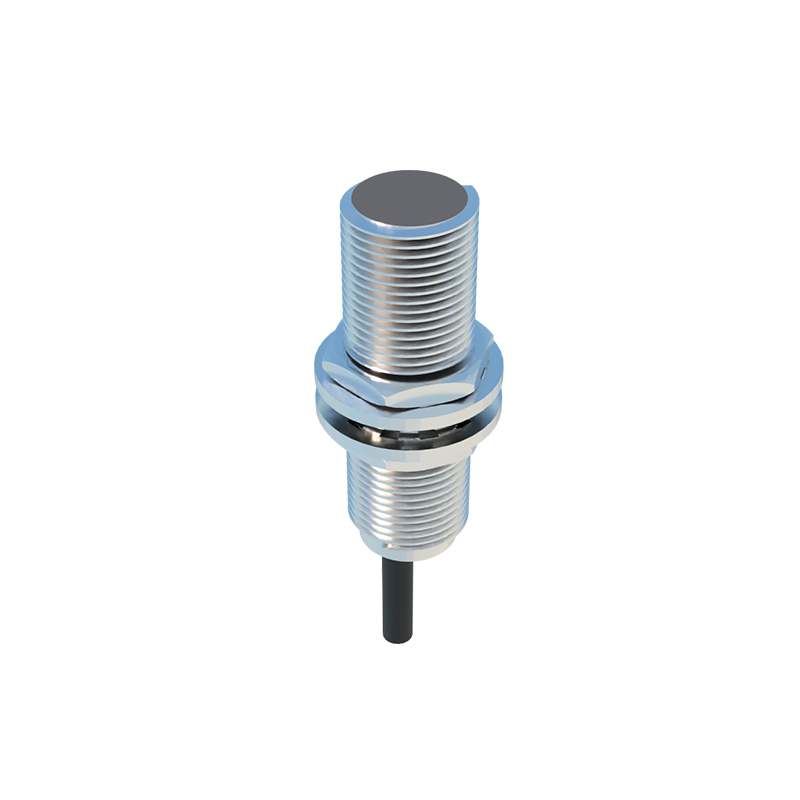
Core Components and Schematic Breakdown
Examining a standard capacitive proximity sensor schematic reveals several key stages. The sensing electrode is connected to a high-frequency oscillator circuit. This oscillator's frequency is directly influenced by the capacitance formed between the electrode and the ground. A typical schematic includes the oscillator, a signal conditioner, a demodulator, a Schmitt trigger, and an output stage. The oscillator generates a signal whose amplitude changes with capacitance. The signal conditioner amplifies this minute change. The demodulator converts the AC signal to a DC voltage proportional to the amplitude. Finally, the Schmitt trigger provides a clean, hysteresis-based digital output signal, ensuring stable switching without chatter.
The Oscillator Circuit: Heart of the Sensor
The oscillator circuit is the most critical part of the schematic. It is commonly configured as a Colpitts or a Hartley oscillator for stable high-frequency operation. In the schematic, capacitors C1 and C2, along with an inductor L1, form the tank circuit. The sensing electrode effectively acts as an additional variable capacitor (Cs) in parallel with this tank. When no target is present, the oscillator runs at its base frequency. As a target approaches, Cs increases, causing the oscillator's frequency to drop and its amplitude to decrease. This amplitude modulation is the primary detectable parameter. The design must carefully balance sensitivity and stability to avoid false triggers from environmental humidity or temperature shifts.
Signal Processing and Output Stage
Following the oscillator, the signal processing chain is vital for reliable operation. The attenuated signal from the oscillator is fed into a high-impedance amplifier stage. This stage boosts the signal for further processing. A precision rectifier and filter circuit then demodulate the AC signal, producing a smooth DC voltage. This DC level is compared against a preset threshold in a comparator with Schmitt trigger characteristics. The hysteresis built into the comparator prevents output oscillation when the sensed signal is near the threshold point. The output stage typically features a solid-state switch (like an NPN/PNP transistor or a MOSFET) or a relay driver, providing either a PNP (sourcing) or NPN (sinking) DC output compatible with PLCs and controllers.
Key Design Considerations in the Schematic
Several factors must be meticulously considered when interpreting or designing this schematic. First is the shielding design. A guard ring or driven shield surrounding the active electrode is often incorporated into the PCB layout to direct the sensing field forward and minimize side sensitivity. Second, compensation circuits for temperature and humidity are frequently added to maintain calibration. Third, the power supply section must be well-regulated and include protection against reverse polarity and voltage transients. The choice of operating frequency (typically between 100 kHz and 1 MHz) is a trade-off between penetration power (for detecting materials behind barriers) and sensitivity to the target material.
Practical Applications and Wiring Diagram
In a practical wiring diagram, a three-wire DC capacitive sensor will have brown (V+), blue (V- or ground), and black (output) wires. The schematic's output stage directly defines the black wire's behavior. For a PNP normally-open sensor, the black wire switches to supply V+ when a target is detected. The schematic must also account for LED indicator circuits and short-circuit protection on the output. These sensors are deployed in level detection for silos (grains, powders), presence detection of non-metallic bottles on conveyor belts, and touch interfaces. Understanding the schematic allows engineers to troubleshoot issues like reduced sensing range (often due to oscillator component drift) or unstable output (often related to insufficient hysteresis or power supply noise).
Conclusion and Integration Tips
A thorough understanding of the capacitive proximity sensor schematic empowers engineers to select, integrate, and maintain these devices effectively. When integrating, ensure the sensor is not mounted flush against a conductive background, as this can create a permanent capacitance load. Allow for the specified dead band. The sensing range in the datasheet is typically defined for a grounded metal target; for other materials, a reduction factor must be applied. By analyzing the schematic, one appreciates the sophisticated yet robust electronics