In the dynamic world of industrial automation and electrical engineering, proximity sensors stand as critical components for non-contact detection, ensuring efficiency and safety in countless applications. For procurement specialists, project managers, and engineers, navigating the cost landscape is a fundamental task. While detailed price lists are often proprietary documents from distributors or manufacturers, "proximity sensor price list images" have become a valuable, albeit informal, resource for preliminary budgeting and market analysis. This guide delves into the utility, interpretation, and limitations of such images within the industry.
Firstly, it's crucial to understand what these images typically represent. They are often screenshots or exported sections from online catalogs, distributor PDFs, or B2B platforms. These visuals usually tabulate sensor models—categorized by type (inductive, capacitive, ultrasonic, photoelectric), sensing range, output configuration (PNP/NPN, NO/NC), housing material (e.g., stainless steel, brass, plastic), and connection type (e.g., M8, M12 connectors, cable exit). Alongside these specifications, a unit price or a price range is listed. The key value of these images lies in providing a rapid, visual snapshot of the price hierarchy across different sensor families and brands.
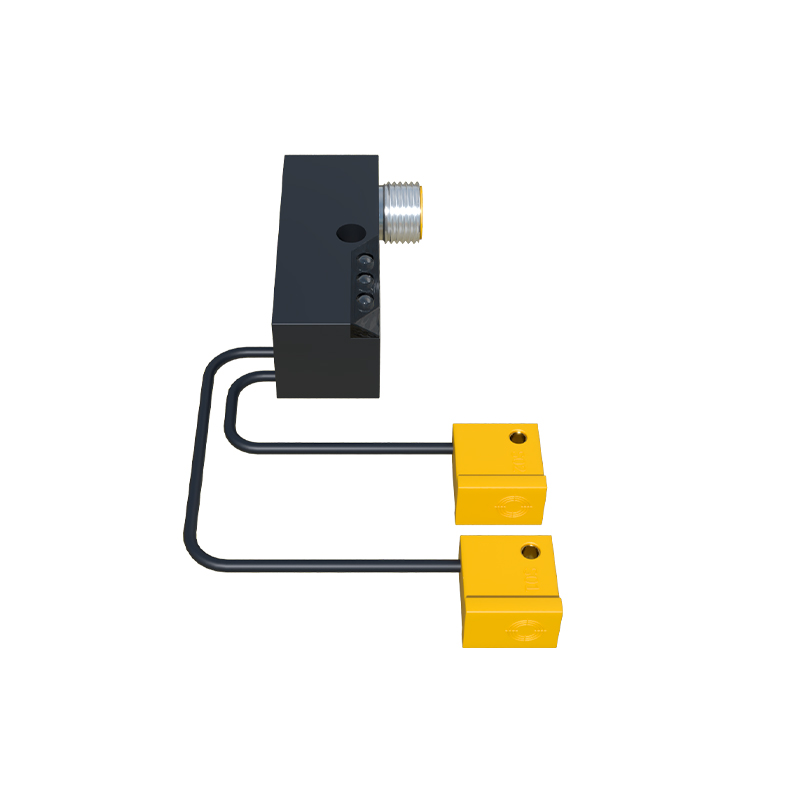
For an engineer, analyzing these images goes beyond just looking at numbers. A savvy professional will assess the price correlation with technical specs. For instance, an inductive proximity sensor with a 15mm sensing range in nickel-plated brass will command a different price than one with a 5mm range in plastic housing. Images allow for quick cross-comparison. You might observe that a standard cylindrical sensor from Brand A is priced 20% lower than a functionally equivalent model from Brand B, prompting further investigation into factors like ingress protection (IP rating), operating temperature range, or brand reputation for durability. This visual benchmarking is an essential first step in the value-engineering process.
However, heavy reliance on static price list images carries significant caveats. The most glaring issue is volatility. Sensor prices are subject to fluctuations due to raw material costs (e.g., copper, plastics), global supply chain dynamics, currency exchange rates, and manufacturer pricing strategies. An image captured six months ago may be entirely obsolete. Furthermore, these images rarely reflect volume discounts, which are a cornerstone of industrial procurement. The unit price for a single sensor is dramatically different from the price for a lot of 500 or 1000 pieces. Contractual agreements between large OEMs and suppliers also render public list prices merely a reference point.
Another limitation is the absence of contextual total cost. A price list image shows the sensor cost but omits ancillary expenses: shipping, import duties, potential cost of compatible cables and connectors, and long-term maintenance. A slightly more expensive sensor with a higher MTBF (Mean Time Between Failures) might offer a lower total cost of ownership, a nuance completely lost in a simple price table.
Therefore, the recommended professional practice is to use these images as a strategic starting point. They are excellent for education, for understanding market positioning, and for preparing internal budget estimates. When precise costing is required for a project, the next step must always be to engage directly with authorized distributors or manufacturer sales representatives. Requesting a formal, current quotation based on your specific volume and application requirements is the only way to obtain accurate figures. Provide them with the exact model numbers you identified from your research for the most efficient process.
In conclusion, proximity sensor price list images serve as a useful tool in the engineer's toolkit for initial market reconnaissance and comparative analysis. They empower professionals to ask informed questions and narrow down options before formal procurement. Yet, their static nature and lack of commercial nuance mean they cannot replace direct supplier engagement and detailed, project-specific quotations. By understanding both the power and the pitfalls of these resources, electrical and automation professionals can make more cost-effective and technically sound purchasing decisions, ensuring project viability and system reliability.