Proximity sensors are integral components in modern automation and control systems, leveraging magnetic fields to detect the presence or absence of objects without physical contact. Understanding the magnetic field distribution diagram of these sensors is crucial for engineers to optimize performance, ensure reliability, and troubleshoot issues in industrial applications. This article delves into the principles behind magnetic field distribution, its graphical representation, and practical implications for sensor deployment.
At the core of inductive and magnetic proximity sensors is the generation of a magnetic field, typically via a coil or permanent magnet. When an object enters this field, it causes a disturbance—such as eddy currents in conductive materials or a change in magnetic flux—that the sensor detects. The magnetic field distribution diagram visually maps the intensity and direction of this field in space, often using contour lines or vector plots. These diagrams illustrate key parameters like sensing range, field strength decay over distance, and directional sensitivity. For instance, a typical diagram might show a conical or spherical field pattern emanating from the sensor face, with field density decreasing exponentially as distance increases. This helps engineers determine the optimal mounting position and orientation to avoid false triggers from adjacent machinery or metallic backgrounds.
In practice, the distribution is influenced by factors such as sensor design (e.g., shielded vs. unshielded types), material composition of the target, and environmental conditions. Shielded sensors, for example, exhibit a more focused field diagram, reducing side detection and making them suitable for tight installations. Unshielded sensors, conversely, have a broader field spread, offering wider coverage but requiring careful spacing. Diagrams often include annotations for dead zones (areas with minimal field activity) and hysteresis regions, where the sensor's switch-on and switch-off points differ slightly to prevent chatter. Engineers use these insights to calibrate sensors for specific tasks, such as precise positioning in assembly lines or detecting ferrous metals in sorting systems.
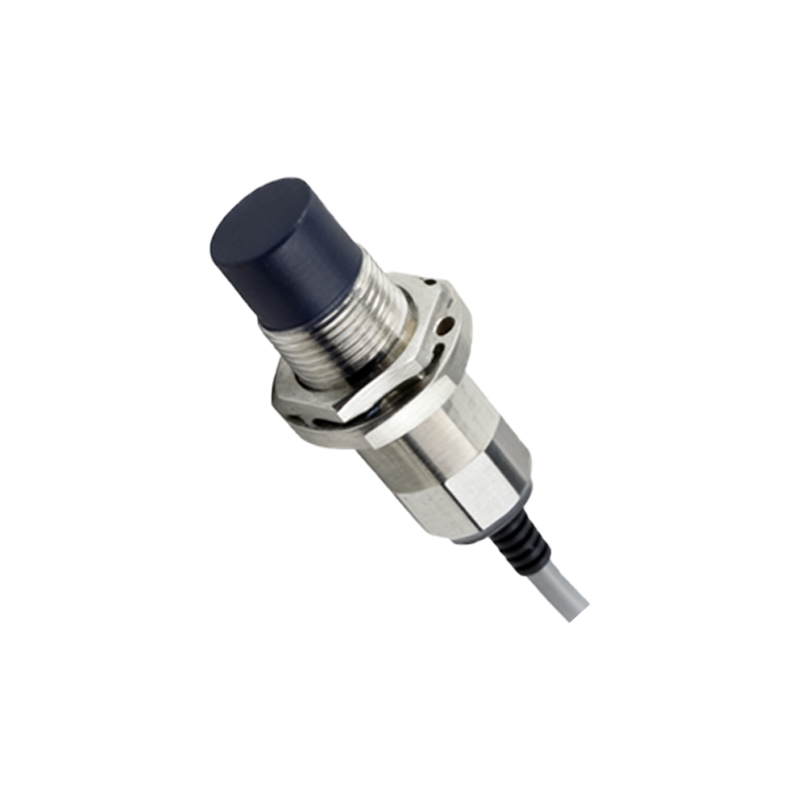
Advanced tools like finite element analysis (FEA) software enable the simulation of magnetic field diagrams, allowing for predictive modeling before physical installation. By analyzing these simulations, professionals can anticipate interference from other electromagnetic sources, assess shielding requirements, and validate sensor selection against operational specs. Case studies in automotive manufacturing highlight how field diagrams aid in integrating sensors into robotic arms, where consistent detection of metal parts is critical for safety and efficiency. Similarly, in packaging industries, diagrams guide the placement of sensors to monitor conveyor belts without disruption from vibration or dust.
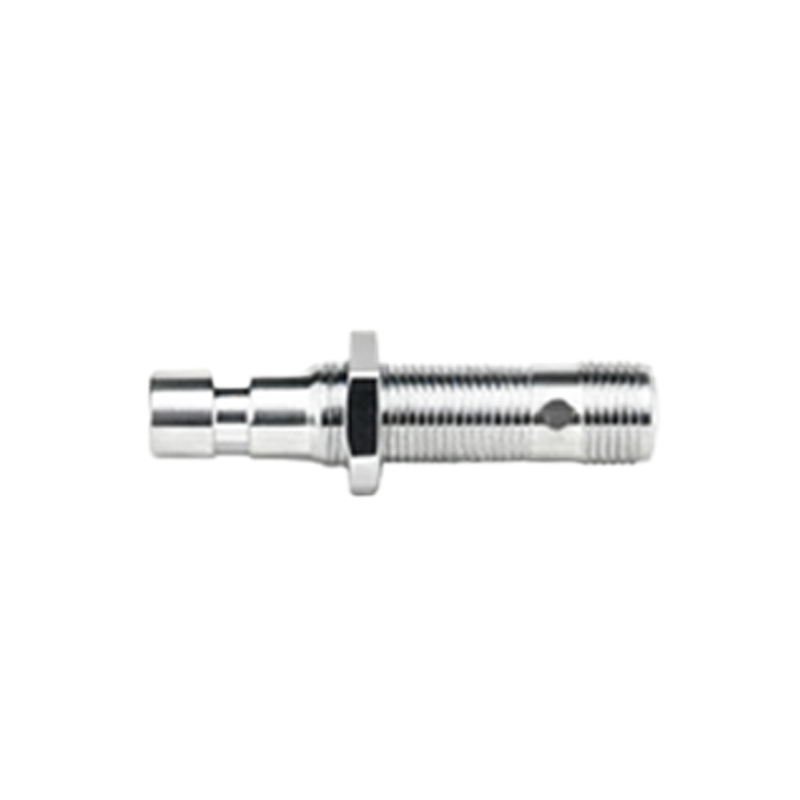
Ultimately, mastering the magnetic field distribution diagram empowers engineers to enhance system accuracy, reduce downtime, and extend sensor lifespan. Regular reference to manufacturer datasheets—which typically include standardized diagrams—combined with on-site testing, ensures alignment with real-world conditions. As Industry 4.0 evolves, leveraging these diagrams in digital twin environments will further streamline automation workflows, making proximity sensors smarter and more adaptive to complex industrial landscapes.