Laser sensor welding diagrams are essential tools in modern electrical engineering, providing a detailed visual representation of how laser sensors are integrated and connected within welding systems. These diagrams illustrate the precise arrangement of components, including laser emitters, receivers, control units, power supplies, and safety mechanisms, ensuring optimal performance in industrial applications. Typically, a laser sensor welding diagram outlines the signal flow from the sensor to the welding controller, highlighting critical interfaces such as analog or digital outputs, communication protocols like Ethernet/IP or PROFINET, and feedback loops for real-time adjustments. Engineers rely on these diagrams to troubleshoot issues, enhance accuracy in weld seam tracking, and maintain consistency in automated manufacturing processes.
The core elements of a laser sensor welding diagram include the laser source, which generates a focused beam for detection; optical components like lenses and mirrors that direct the beam; and photodetectors that convert reflected light into electrical signals. These signals are processed by a central processing unit (CPU) or programmable logic controller (PLC), which interprets data to guide welding torches or robots. Diagrams often feature annotations for voltage levels, typically ranging from 24V DC for sensor operation to higher voltages for welding power circuits, and specify grounding points to prevent electromagnetic interference (EMI). Additionally, safety interlocks, such as emergency stop circuits and light curtains, are depicted to comply with industry standards like ISO 13849 for machinery safety.
In practice, interpreting a laser sensor welding diagram requires an understanding of schematic symbols, such as triangles for amplifiers or circles for connectors, and familiarity with wiring color codes—for instance, red for positive DC lines and black for negative. Engineers must ensure proper shielding for signal cables to minimize noise from high-current welding arcs, which can disrupt sensor readings. Calibration points indicated on the diagram, like potentiometers for sensitivity adjustment, are crucial for aligning sensors with weld joints, especially in applications involving thin materials or complex geometries. Regular maintenance checks, guided by these diagrams, help prevent downtime by identifying wear in optical surfaces or loose connections.
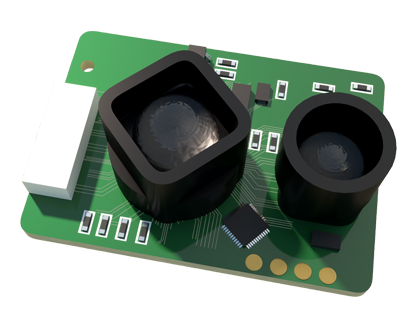
Advancements in laser sensor technology have led to more sophisticated diagrams incorporating IoT-enabled devices for predictive maintenance. For example, diagrams may now include cloud connectivity symbols or data logging modules that monitor sensor health and welding quality over time. This evolution supports Industry 4.0 initiatives, enabling remote diagnostics and efficiency improvements. Ultimately, mastering laser sensor welding diagrams empowers electrical engineers to design robust, high-precision welding systems that enhance productivity while ensuring safety and reliability in demanding industrial environments.