Proximity sensors are fundamental components in modern industrial automation, robotics, and countless electronic devices. Their ability to detect the presence or absence of an object without physical contact makes them invaluable for tasks ranging from precise positioning to safety interlocks. Understanding their working principle, best visualized through a functional diagram, is crucial for effective selection, integration, and troubleshooting. This article delves into the core operational concepts of the primary proximity sensor types, breaking down the key elements of a standard working principle diagram.
At its heart, a proximity sensor operates by emitting a field or beam and detecting changes in that field caused by a target object. The absence of mechanical contact eliminates wear and tear, ensuring high reliability and long operational life. The working principle diagram typically illustrates three main stages: the oscillator/emitter, the detection circuit, and the output stage.
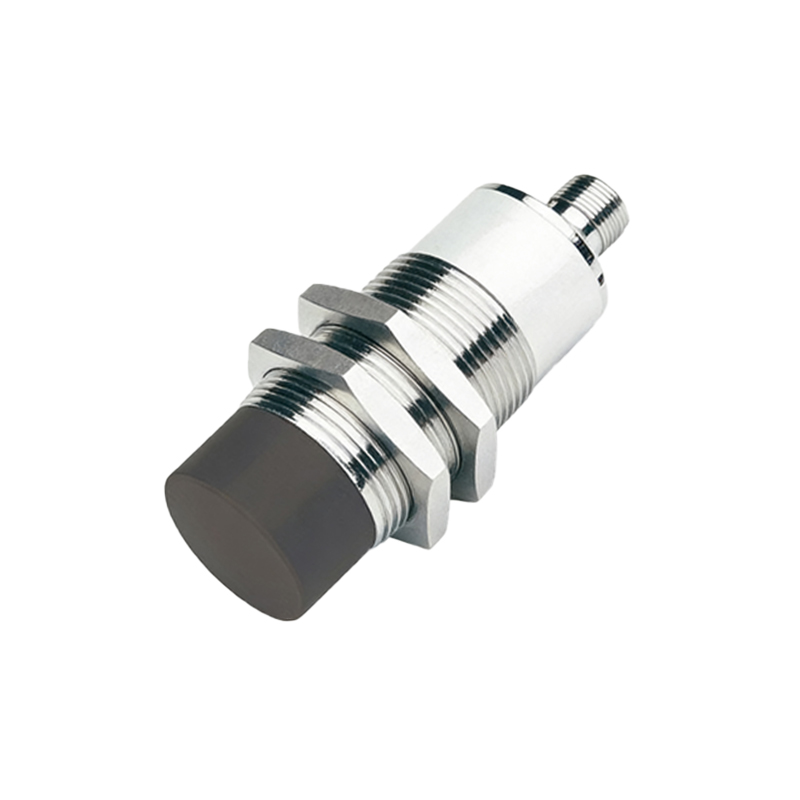
1. Inductive Proximity Sensors
The most common diagram depicts an inductive sensor. The core component is an oscillator circuit that generates a high-frequency electromagnetic field at the active face of the sensor, emanating from a coil. When a metallic target enters this field, eddy currents are induced on the surface of the target. These eddy currents draw energy from the oscillator, causing a reduction in its oscillation amplitude. The detection circuit, often a Schmitt trigger, monitors this amplitude. Once the amplitude drop exceeds a predefined threshold (the sensing distance), the circuit triggers the output stage to switch. The output stage, shown as a solid-state switch (like a transistor) or a relay symbol, changes state, providing a signal to a PLC, counter, or other control device. The diagram clearly shows the field lines, the target, the damped oscillation waveform, and the resultant switching action.
2. Capacitive Proximity Sensors
The diagram for a capacitive sensor shares similarities but highlights different physics. Here, the active face forms one plate of a capacitor, with the target (or the mounting base) acting as the other plate. The oscillator circuit is tuned to the capacitance of this arrangement. When any material (metallic or non-metallic, liquid or solid) with a dielectric constant different from air enters the sensing field, it alters the capacitance. This change in capacitance affects the oscillator's characteristics, similar to the inductive type. The detection circuit senses this change and commands the output stage to switch. Diagrams often include symbols for dielectric materials and show the electric field lines extending beyond the sensor face.
3. Photoelectric Sensors
While often grouped separately, photoelectric sensors are a key proximity technology. Their principle diagram is distinct, showing an emitter (LED or laser) and a receiver (phototransistor or photodiode). In the diffuse (reflective) mode, both are housed in the same unit. The emitted light strikes a target and is reflected back to the receiver. The detection circuit evaluates the intensity of the received light. When sufficient light returns (target present), the output is activated. Through-beam diagrams show separate units, where the output triggers when the target interrupts the beam. Retro-reflective models use a reflector, with interruption causing the switch.
4. Ultrasonic Sensors
The diagram for an ultrasonic sensor illustrates a transmitter (piezoelectric crystal) emitting high-frequency sound pulses and a receiver waiting for the echo. A timing circuit measures the time interval between pulse emission and echo reception. When a target enters the predefined range, the time-of-flight decreases, and the detection circuit processes this data to trigger the output. This principle is akin to sonar or radar.
Key Diagram Elements & Selection Criteria:
A comprehensive diagram or system view will also indicate critical parameters:
Sensing Distance (Sn): The nominal operating distance where reliable detection occurs.
Hysteresis: The difference between the switch-on and switch-off points, preventing chatter near the sensing edge.
Output Type: Depicted as PNP (sourcing), NPN (sinking), analog (4-20mA, 0-10V), or IO-Link.
Shielding: Inductive sensor diagrams may show a shielded (flush-mountable) or unshielded (non-flush) design, affecting the field shape and installation.
For an engineer, interpreting these diagrams informs selection. Choose inductive for metals only, capacitive for diverse materials including liquids, photoelectric for long ranges and small objects, and ultrasonic for harsh environments or distance measurement. Always consider the target material, size, required sensing distance, environmental conditions (dust, moisture, temperature), and the needed electrical output.
In conclusion, the working principle diagram of a proximity sensor is a vital tool that translates abstract electrical concepts into a clear visual narrative of detection. By deconstructing the diagram into its core blocks—oscillator/emitter, detection circuit, and output stage—engineers can confidently specify, deploy, and maintain these sensors, ensuring robust