In the realm of industrial automation and precision engineering, laser sensors have become indispensable tools for measurement, detection, and positioning tasks. A critical component in effectively deploying these sensors is the laser sensor position diagram. This technical document serves as a blueprint, guiding engineers in the optimal placement, alignment, and integration of laser sensors within a system or machine. Unlike a simple schematic, a position diagram provides a detailed spatial representation, often including coordinate axes, reference points, tolerance zones, and critical distances.
The primary function of a laser sensor position diagram is to ensure measurement accuracy and repeatability. Laser sensors operate on principles such as time-of-flight, triangulation, or confocal measurement. Their performance is highly sensitive to installation parameters. For instance, in a triangulation-based sensor used for height profiling, the angle and distance between the laser emitter, the target surface, and the receiver are mathematically fixed. A position diagram specifies this geometric relationship precisely, often down to the millimeter or sub-millimeter level. Deviations from the specified position can introduce significant errors, such as cosine error, where an angular misalignment causes the measured distance to be longer than the actual perpendicular distance to the target.
A well-constructed position diagram typically includes several key elements. First, it defines the global coordinate system of the machine or work cell, establishing a common reference frame. The sensor's mounting location is then specified within this frame using precise X, Y, and Z coordinates. The diagram also illustrates the sensor's orientation, indicating the direction of the laser beam via vectors or angles (e.g., pitch, yaw). Critical operational ranges are marked, such as the stand-off distance (the distance from the sensor housing to the nominal target) and the measurement range (the span within which accurate data can be acquired). Furthermore, it outlines the "field of view" or "spot position" relative to the target area, which is crucial for applications like edge detection or width measurement.
Environmental factors and potential obstructions are also considered in advanced diagrams. This may involve specifying keep-out zones to prevent physical damage to the sensor or indicating areas where ambient light, reflective surfaces, or vibrational interference could degrade signal quality. For systems employing multiple sensors, the diagram becomes even more vital, coordinating their positions to avoid optical crosstalk—where one sensor's laser beam interferes with another's receiver—and to ensure complete coverage of the inspection area without blind spots.
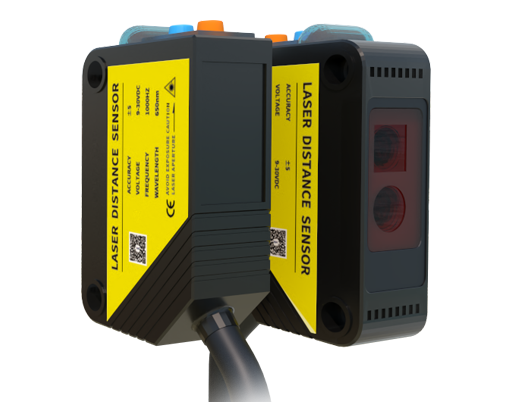
The creation of a laser sensor position diagram is a collaborative process involving mechanical design, electrical engineering, and application expertise. It begins during the system design phase using CAD (Computer-Aided Design) software. Engineers model the machine components, the intended target path, and the sensor models. Simulations might be run to analyze the beam path and detect potential collisions or alignment issues before physical installation. This virtual prototyping saves considerable time and cost.
During installation and commissioning, technicians rely on the position diagram as a step-by-step guide. They use precision tools like dial indicators, alignment lasers, and theodolites to position the sensor bracket according to the specified coordinates. Fine-tuning is often performed by observing the sensor's output signal while adjusting its position until it falls within the optimal window defined in the diagram. This process is documented, sometimes with photographs or verification measurements, becoming part of the system's quality records.
Maintenance and troubleshooting also leverage these diagrams. When a sensor's performance drifts or fails, the first step is often to verify its physical position and alignment against the original diagram. Thermal expansion, mechanical shock, or inadvertent contact can shift mounts over time. Having a definitive reference allows for swift recalibration or identification of root causes, minimizing machine downtime.
In summary, the laser sensor position diagram is far more than a drawing; it is a foundational document for precision. It translates theoretical sensor specifications into practical, reliable performance on the factory floor. By meticulously defining spatial relationships, it ensures that the advanced capabilities of laser sensing technology are fully realized, leading to improved product quality, higher throughput, and more robust automated systems. As industries move towards tighter tolerances and smarter manufacturing, the role of these precise positional guides will only grow in importance.