In the realm of industrial automation, pneumatic proximity sensors play a crucial role in non-contact detection of objects, leveraging air pressure and flow principles. This article delves into the schematic diagram of these sensors, explaining their operational mechanics and key components for engineers and technicians in the electrical and automation fields.
A pneumatic proximity sensor typically consists of an air supply inlet, a sensing nozzle, a pressure switch, and output ports. The schematic diagram visually represents these elements and their interconnections, providing a blueprint for understanding how the sensor functions. Air is supplied at a constant pressure, usually between 1.5 to 8 bar, through the inlet. This air flows toward the sensing nozzle, which is positioned close to the target object. When no object is present, air escapes freely from the nozzle, resulting in low backpressure in the system. However, when an object approaches the nozzle within a specified range, it obstructs the airflow, causing a rapid increase in backpressure. This pressure change is detected by a diaphragm or piston mechanism connected to a pressure switch.
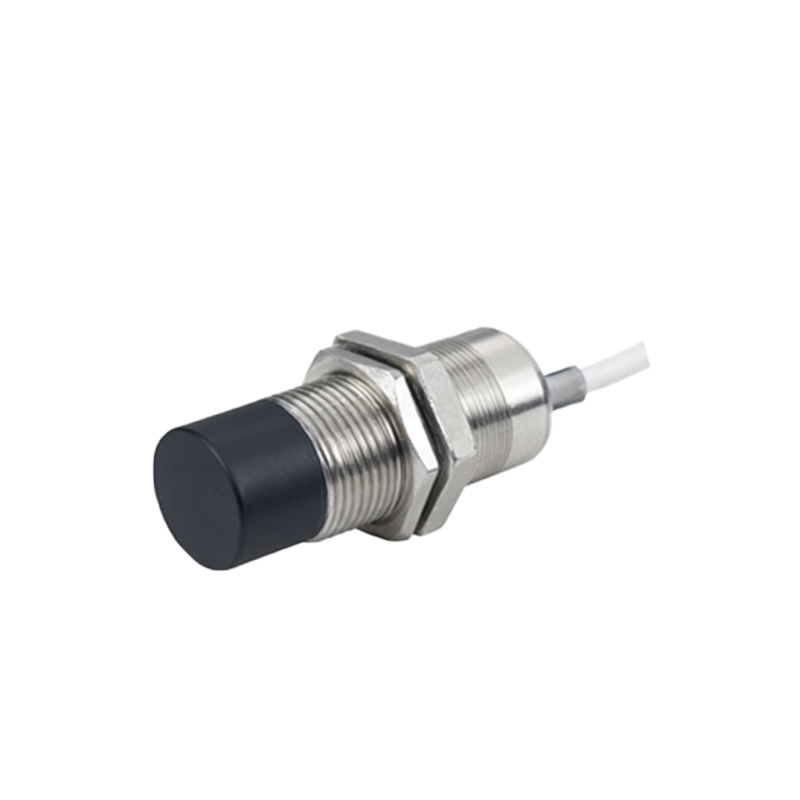
The pressure switch is a critical component in the schematic, often depicted with electrical contacts. As backpressure rises, it actuates the switch, changing its state from normally open (NO) to closed or vice versa. This triggers an electrical signal at the output ports, which can be used to control machinery, such as stopping a conveyor belt or activating a robotic arm. The schematic includes symbols for these electrical connections, highlighting compatibility with PLCs (Programmable Logic Controllers) and other control systems. Key parameters like sensing distance, response time, and operating pressure are often annotated in the diagram, aiding in selection and troubleshooting.
One advantage of pneumatic proximity sensors, as shown in their schematics, is their simplicity and robustness. They contain no electronic parts, making them suitable for harsh environments with high temperatures, dust, or moisture. The diagram illustrates this by emphasizing mechanical parts like springs and seals. Additionally, these sensors are immune to electrical interference, ensuring reliable operation in noisy industrial settings. Engineers can refer to the schematic to identify failure points, such as clogged nozzles or worn diaphragms, and perform maintenance accordingly.
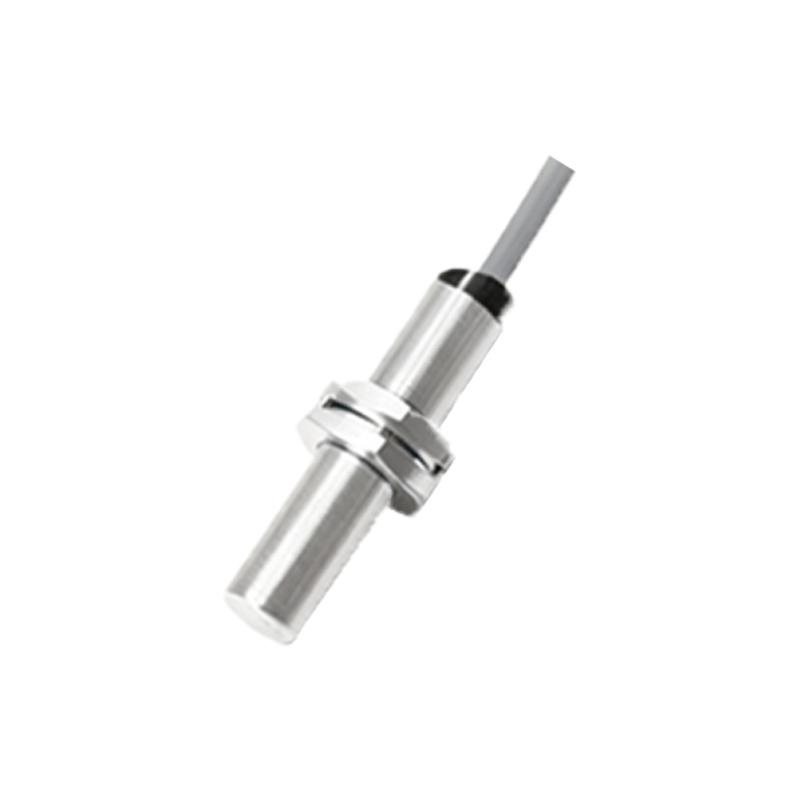
In practice, reading a pneumatic proximity sensor schematic requires familiarity with standard symbols. For instance, triangles may represent air flow direction, while circles denote pressure points. The diagram often includes a legend explaining these symbols, along with notes on installation—like ensuring proper alignment to avoid false triggers. Variations exist, such as retro-reflective or through-beam designs, where the schematic adapts to show additional components like reflectors or separate emitter and receiver units. Understanding these nuances helps optimize sensor placement for maximum efficiency.
Overall, the schematic diagram serves as an essential tool for deploying and maintaining pneumatic proximity sensors. By mastering its interpretation, professionals can enhance system reliability, reduce downtime, and improve safety in automated processes. As industries evolve toward smarter factories, these sensors remain integral, and their schematics continue to guide innovation in pneumatic control technology.