In the realm of industrial automation and process control, powder proximity sensors play a crucial role in detecting the presence or level of powdered materials without direct physical contact. These sensors are widely used in industries such as food processing, pharmaceuticals, chemicals, and plastics, where precise monitoring of bulk solids is essential for operational efficiency and safety. To fully grasp their functionality, it is vital to delve into the schematic diagram that outlines their electrical and operational principles. This article provides an in-depth analysis of the typical schematic diagram for a powder proximity sensor, breaking down its components and their interactions.
At its core, a powder proximity sensor operates based on capacitive sensing technology. The schematic diagram typically illustrates a circuit that includes a sensing electrode, an oscillator, a signal conditioning unit, and an output stage. The sensing electrode, often designed as a probe or plate, is positioned near the area where powder detection is required. When no powder is present, the electrode's capacitance remains at a baseline level, determined by the surrounding environment (e.g., air). As powder approaches or accumulates, the dielectric properties change, altering the capacitance between the electrode and ground. This change is the fundamental input for the sensor's operation.
In the schematic, the oscillator circuit is connected to the sensing electrode. It generates a high-frequency signal that is influenced by the capacitance variations. As the capacitance increases due to powder proximity, the oscillator's frequency or amplitude shifts accordingly. This modulated signal is then fed into a signal conditioning unit, which typically comprises amplifiers, filters, and comparators. The signal conditioning stage amplifies the weak signal, filters out noise from industrial environments (such as electromagnetic interference), and converts it into a stable voltage or current signal. This processed signal is crucial for accurate detection, ensuring that the sensor responds only to genuine powder presence and not to false triggers.
The output stage of the schematic diagram shows how the sensor interfaces with external control systems. Common output configurations include analog outputs (e.g., 4-20 mA or 0-10 V) and digital outputs (e.g., relay switches or transistor-transistor logic). In the schematic, this stage often includes components like operational amplifiers for analog outputs or solid-state relays for digital switching. The output signal is proportional to the powder level or presence, allowing for integration with programmable logic controllers (PLCs) or other automation devices. For instance, in a silo monitoring application, the sensor's output might trigger an alarm when powder reaches a high level, preventing overfills.
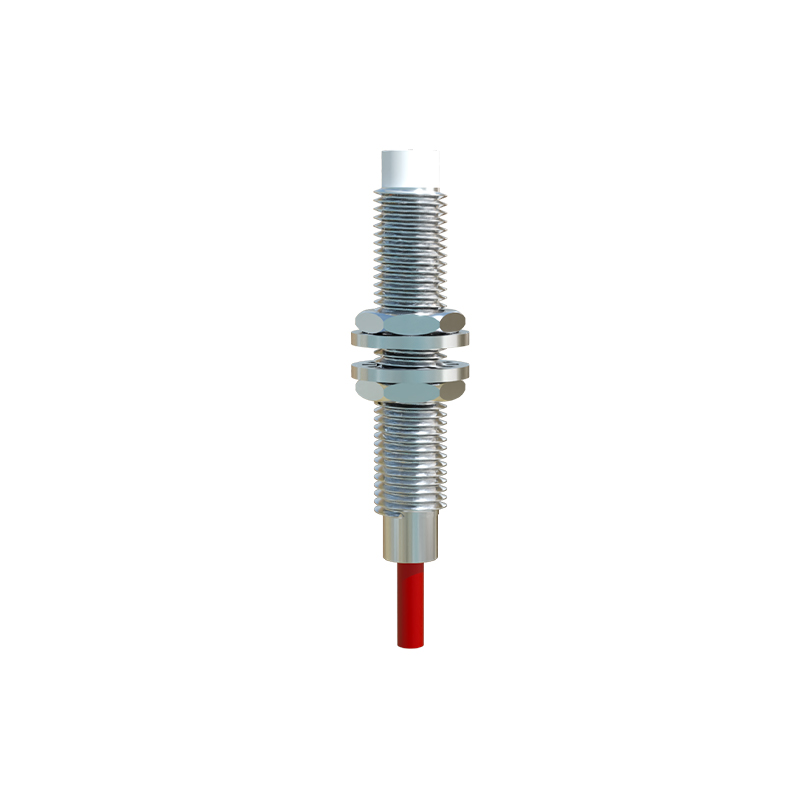
Additionally, the schematic diagram may include power supply sections, protection circuits, and calibration adjustments. Power is typically supplied as DC voltage (e.g., 12-24 VDC), with regulators and capacitors to ensure stable operation. Protection circuits, such as surge suppressors or polarity reversal safeguards, are integrated to enhance durability in harsh industrial settings. Calibration trimmers or potentiometers allow technicians to fine-tune the sensor's sensitivity, adapting it to specific powder types or environmental conditions. This adjustability is key for optimizing performance across diverse applications, from fine flour in bakeries to coarse granules in chemical plants.
Understanding the schematic diagram also highlights design considerations for reliability and safety. For example, the sensing electrode must be insulated to prevent electrical leakage or short circuits, especially in conductive powder environments. The schematic often shows grounding points and shielding to minimize interference. Moreover, compliance with industry standards (e.g., IEC or ATEX for explosive atmospheres) may be reflected in the diagram through specific component choices or isolation barriers. By studying these elements, engineers can troubleshoot issues, perform maintenance, or customize sensors for unique operational needs.
In practice, interpreting the schematic diagram enables effective installation and integration. Technicians use it to verify wiring connections, test signal paths, and diagnose faults like false readings or output failures. For instance, if a sensor fails to detect powder, the schematic helps trace the circuit from the electrode to the output, checking for component failures or misconfigurations. Regular reference to the diagram during calibration ensures that the sensor maintains accuracy over time, reducing downtime and improving process control.
In summary, the schematic diagram of a powder proximity sensor serves as a blueprint for its operation, detailing how capacitive sensing translates into reliable detection signals. By examining the oscillator, signal conditioning, and output stages, along with auxiliary circuits, professionals can harness these sensors for efficient powder management. As industries continue to automate, mastering such schematics becomes essential for optimizing performance and ensuring safety in powder-handling applications.