In industrial automation and robotics, proximity sensors play a critical role in detecting the presence or absence of objects without physical contact. Among various visualization tools used to interpret sensor data, the proximity sensor ring chart stands out as an intuitive and efficient method for representing detection ranges, zones, and operational statuses. This chart typically displays concentric rings or circular bands, each corresponding to specific detection distances or sensitivity levels of the sensor.
The primary function of a proximity sensor ring chart is to provide a clear graphical overview of the sensor's effective range. For instance, the innermost ring might indicate the closest detection zone, where objects are reliably detected with high precision. Middle rings represent intermediate distances, while outer rings show the maximum detection limits. This layered visualization helps engineers and technicians quickly assess whether an object falls within a desired operational range, facilitating real-time adjustments in automated systems.
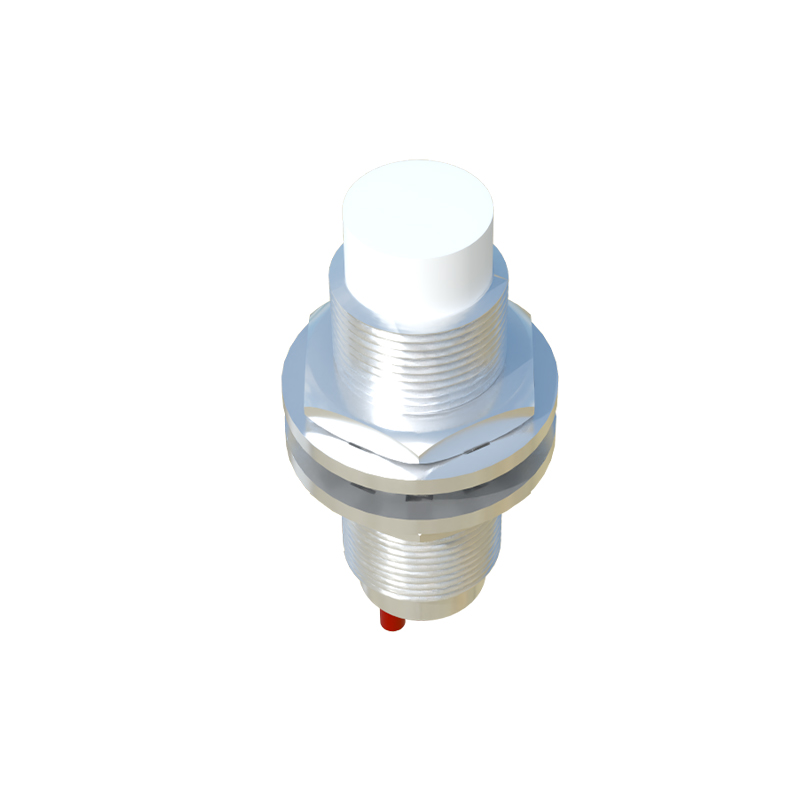
One key advantage of using a ring chart is its ability to simplify complex data. Proximity sensors often generate multidimensional information, including distance, signal strength, and response time. By mapping these parameters onto a circular diagram, users can easily identify patterns or anomalies. For example, a consistent gap in one segment of the ring might indicate an obstruction or sensor misalignment, prompting immediate troubleshooting. This visual approach reduces the cognitive load on operators, enabling faster decision-making in high-speed production environments.
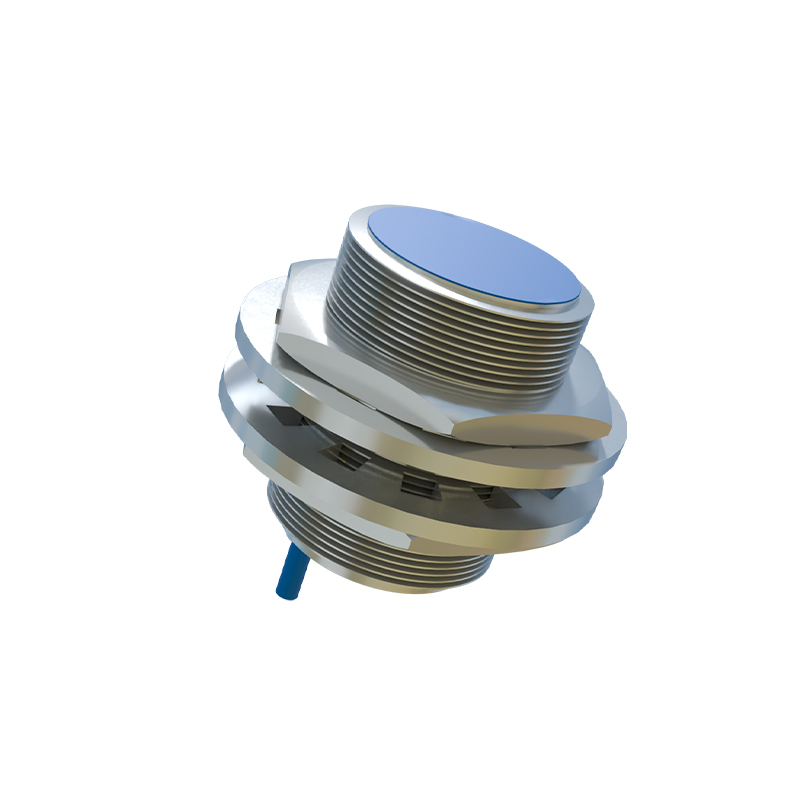
Moreover, proximity sensor ring charts are highly customizable to suit different sensor types, such as inductive, capacitive, or ultrasonic sensors. Each sensor category has unique characteristics—inductive sensors excel at detecting metals, while capacitive sensors respond to non-metallic materials. The ring chart can be tailored to highlight these specifics, using color codes or labels to denote material compatibility, sensitivity thresholds, or environmental factors like temperature effects. This adaptability makes the chart a versatile tool across industries, from automotive manufacturing to food processing.
In practice, integrating ring charts with modern control systems enhances operational efficiency. Many programmable logic controllers (PLCs) and human-machine interfaces (HMIs) now support dynamic ring chart displays that update in real-time. As a sensor detects objects, the corresponding ring segment may change color or intensity, providing instant visual feedback. This integration allows for proactive maintenance; gradual changes in ring patterns can signal sensor wear or calibration drift before failures occur, minimizing downtime and maintenance costs.
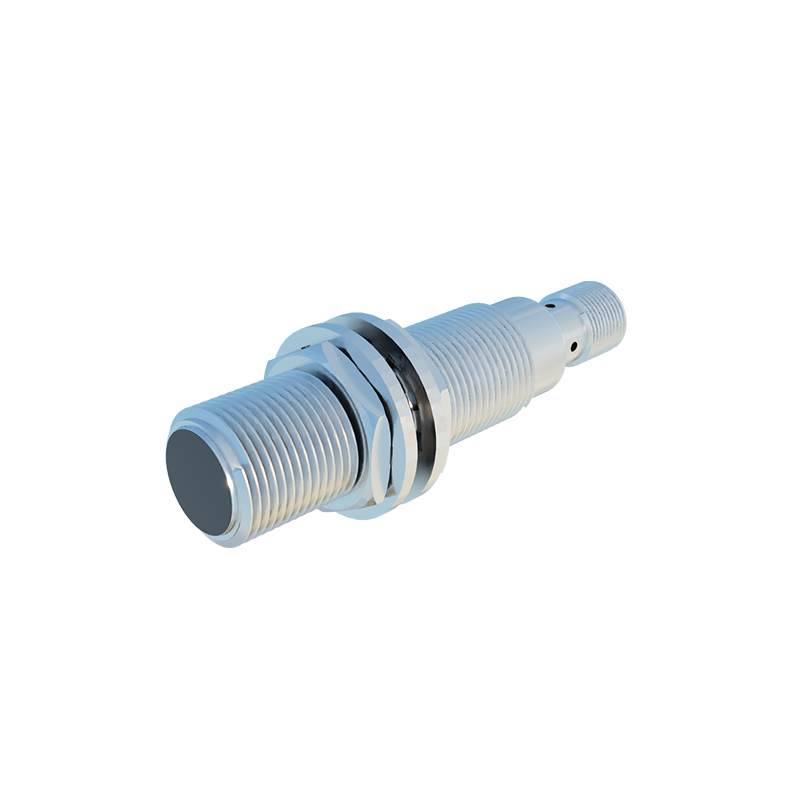
Despite its benefits, effective use of proximity sensor ring charts requires proper calibration and interpretation. Users must ensure that the chart accurately reflects the sensor's actual performance, accounting for factors like object size, material, and ambient conditions. Regular calibration against known reference points is essential to maintain accuracy. Additionally, training personnel to read and respond to chart variations is crucial for maximizing its utility in safety-critical applications, such as collision avoidance in robotic arms or assembly lines.
Looking ahead, advancements in sensor technology and data visualization are likely to evolve the ring chart further. With the rise of Industry 4.0 and the Internet of Things (IoT), these charts may incorporate predictive analytics, using historical data to forecast sensor behavior or optimize detection zones. Interactive features, such as zoomable rings or integration with augmented reality (AR) interfaces, could also enhance usability. Ultimately, the proximity sensor ring chart remains a foundational tool, bridging raw sensor data with actionable insights for smarter, more responsive automation systems.