Proximity switch sensors are fundamental components in industrial automation, providing non-contact detection of metallic or non-metallic objects. The waveform diagram of a proximity sensor is a critical tool for engineers to diagnose performance, understand operational characteristics, and ensure system reliability. This article delves into the interpretation of these waveforms, their significance in various applications, and common analysis techniques.
At its core, a proximity sensor operates by generating an electromagnetic field or a beam of light. When a target object enters this field, it causes a detectable change. The electrical output of the sensor, typically a switching signal, is represented graphically over time as a waveform. The most common output types are NPN (sinking) and PNP (sourcing) DC configurations, as well as analog and IO-Link variants, each with distinct waveform signatures.
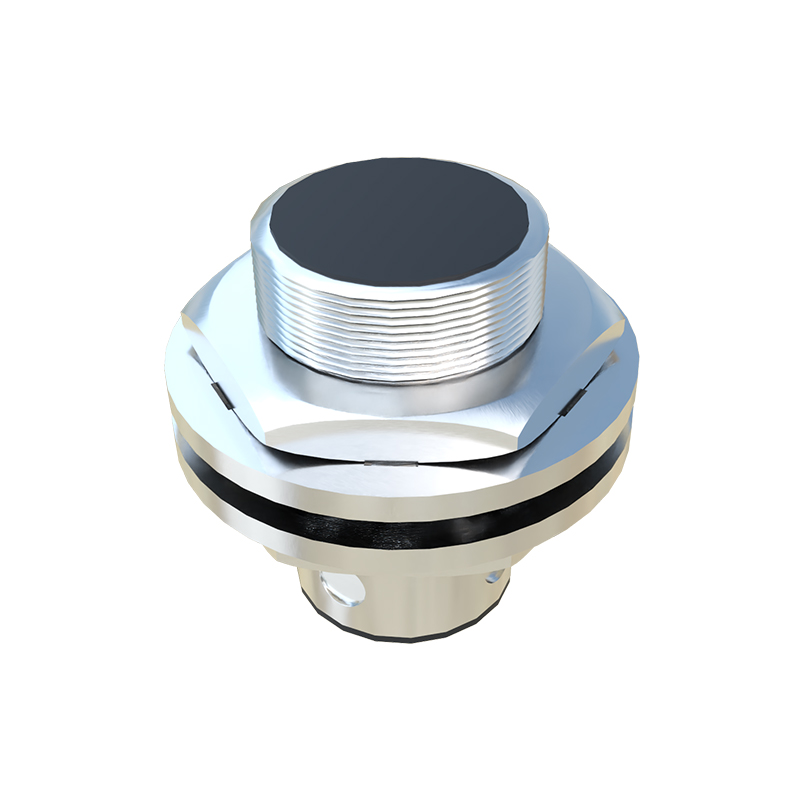
A standard digital output proximity sensor waveform depicts voltage on the vertical axis and time on the horizontal axis. In the idle state (no target present), the output voltage remains at a defined level—either high (near the supply voltage, e.g., 24V DC for a PNP) or low (near 0V for an NPN). The moment a valid target enters the sensing range, the output state switches. On the waveform, this is shown as a near-vertical transition line from one voltage level to the other. The steepness of this edge indicates switching speed, a key parameter for high-speed applications. The waveform then remains stable at the new level as long as the target is within range. Upon the target's exit, the waveform transitions back to its original idle state.
Critical parameters are directly readable from this waveform. Switching Hysteresis is visible as the difference between the "switch-on" point (when the target approaches) and the "switch-off" point (when the target recedes). This prevents chatter when a target is at the borderline of the sensing range. The waveform clearly shows two distinct distance thresholds. Response Time is measured from the moment the target reaches the effective sensing point to the moment the output signal completes its transition. This is often broken down into "turn-on delay" and "turn-off delay." A clean, sharp transition edge signifies a fast response time, while a sloped or noisy edge may indicate issues.
For analog output sensors, the waveform shows a continuous voltage or current signal proportional to the distance to the target. Instead of a square wave, engineers observe a curve. As the target approaches, the output signal ramps up or down linearly (or according to the sensor's specific characteristic curve) within its defined span. Analyzing this analog waveform helps verify linearity, range, and resolution. Any unexpected flattening, noise, or instability in the curve can indicate problems like insufficient supply voltage, electrical interference, or mechanical misalignment.
Oscilloscopes are the primary instrument for capturing and analyzing these waveforms. When probing, it is essential to connect the ground clip correctly and use appropriate voltage scales. A common diagnostic practice is to compare the observed waveform against the ideal waveform provided in the sensor's datasheet. Deviations are telltale signs of specific issues. For instance, a rounded or slow-rise transition edge might suggest an overloaded output or a failing component. Electrical noise superimposed on the signal, appearing as high-frequency "jitter" on the top or bottom of the square wave, often points to electromagnetic interference (EMI) from nearby motors, drives, or power lines. In such cases, inspecting the waveform guides mitigation steps like shielding, filtering, or grounding improvements.
In high-speed counting or precision positioning applications, waveform analysis is indispensable. Engineers examine the consistency of pulse timing and amplitude to ensure error-free operation. A waveform that shows occasional missed pulses or variations in pulse height can lead to system inaccuracies. Furthermore, understanding the waveform helps in selecting the right sensor for an application. A sensor with a very fast response time (evident from a steep waveform edge) is necessary for detecting rapidly moving objects on a conveyor, whereas a sensor with pronounced hysteresis (clear gap in the on/off points on the waveform) might be preferred for robust object detection in vibrating environments.
In conclusion, the waveform diagram is more than just a technical graph; it is the language through which a proximity switch sensor communicates its health and performance. Mastery of waveform interpretation empowers engineers to perform effective troubleshooting, optimize system design, and ensure the longevity and reliability of automated processes. Regular waveform checks during commissioning and maintenance can preempt failures, reduce downtime, and maintain peak operational efficiency in any industrial setting.