In the automotive industry, proximity switch sensors play a critical role in enhancing vehicle safety, efficiency, and user experience. These sensors detect the presence or absence of objects without physical contact, relying on electromagnetic fields, infrared light, or ultrasonic waves. By examining images of automotive proximity switch sensors, engineers and technicians can gain valuable insights into their design, functionality, and application.
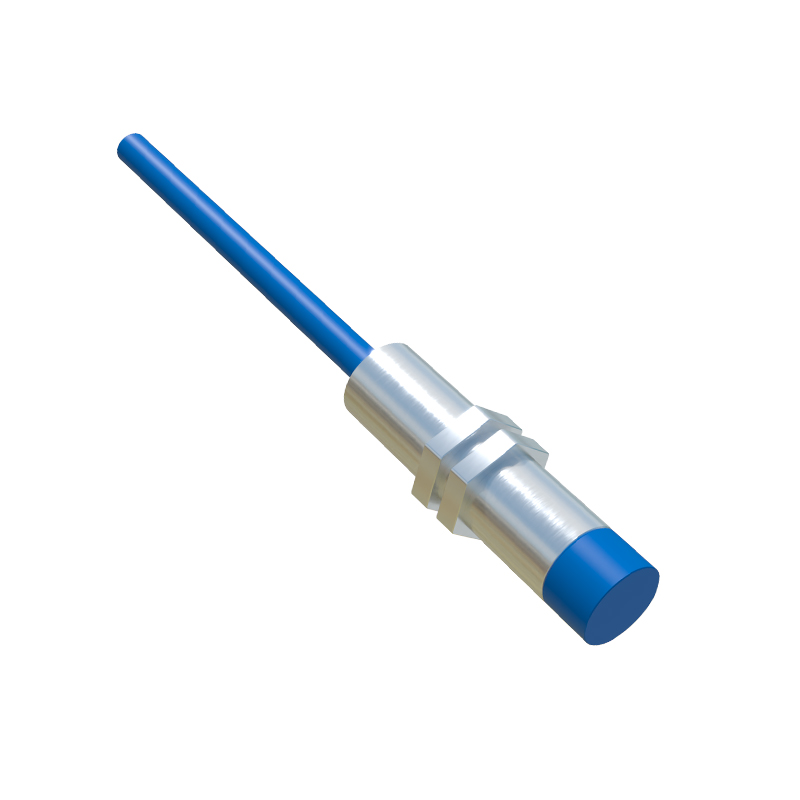
A typical image of an automotive proximity switch sensor reveals a compact, durable housing, often made from materials like stainless steel or high-grade plastics to withstand harsh environments. The sensor body may include mounting brackets, connectors, and indicator LEDs. Internally, components such as coils, oscillators, and signal processing circuits are visible in cross-sectional diagrams. For instance, inductive proximity sensors, commonly used for detecting metal objects, show a coil wound around a ferrite core. When a metal target enters the sensing range, it alters the electromagnetic field, triggering a switch output. Images often highlight the sensing face, where the detection occurs, and specify key parameters like sensing distance, which typically ranges from 2mm to 40mm in automotive applications.
In parking assistance systems, images depict ultrasonic proximity sensors embedded in bumpers. These sensors emit sound waves and measure the time taken for echoes to return, calculating distances to obstacles. Visual guides show how multiple sensors create a coverage zone, with color-coded displays indicating proximity levels on the vehicle’s infotainment screen. For example, green may represent a safe distance, yellow for caution, and red for immediate stop. Such imagery helps in understanding the integration of sensors with control units and alert mechanisms.
Another application is in automatic door systems for vehicles like buses or luxury cars. Here, images illustrate infrared proximity sensors installed near doors. They emit infrared beams and detect reflections from approaching passengers, preventing accidental closures. Diagrams often include wiring schematics, showing connections to power sources and actuators. Engineers can analyze these images to troubleshoot issues, such as misalignment or signal interference, by comparing actual installations with reference visuals.
Technical images also emphasize environmental resilience. For instance, sensors used in engine compartments or wheel areas are shown with IP67 or higher ratings, indicating protection against dust and water immersion. Cutaway views reveal sealed casings and conformal coatings on circuit boards, ensuring reliability under temperature extremes and vibration. Additionally, images of diagnostic tools, like oscilloscopes capturing sensor waveforms, aid in performance verification. A waveform might show a clean digital signal when a target is detected, versus noise when faulty, providing visual cues for maintenance.
In electric vehicles (EVs), proximity sensors are integral to charging systems. Images display sensors on charging ports that detect the connector’s insertion, initiating secure power transfer. Close-ups highlight Hall-effect sensors, which respond to magnetic fields from the charger, with diagrams explaining their role in safety interlocks. These visuals are crucial for training technicians on EV-specific protocols, reducing risks of electrical hazards.
Furthermore, advancements in smart manufacturing have led to high-resolution 3D renderings of proximity sensors. These images allow for virtual prototyping, showcasing miniaturized designs for compact spaces like steering columns or brake pedals. Annotated graphics detail surface-mount technology (SMT) components, emphasizing how modern sensors achieve faster response times and lower power consumption. For example, a sensor image might note a response time of 0.5ms, vital for real-time applications like collision avoidance.
When interpreting these images, it’s essential to consider industry standards. References to ISO 11452 for electromagnetic compatibility or SAE J1455 for environmental testing may appear in captions, guiding compliance. Images often include calibration charts, showing how sensor output varies with target material or distance, enabling precise adjustments. In training materials, side-by-side comparisons of different sensor types—inductive, capacitive, ultrasonic—help in selecting the right technology based on factors like target composition or cost constraints.
In summary, automotive proximity switch sensor images serve as powerful educational and diagnostic tools. They bridge theoretical knowledge with practical implementation, illustrating everything from basic operation to complex integrations. As vehicles evolve toward autonomy, these visuals will continue to support innovation, ensuring sensors meet rigorous demands for accuracy and durability. Engineers are encouraged to study such imagery regularly, staying updated with trends like wireless sensor networks or AI-enhanced diagnostics, which are increasingly depicted in technical publications and OEM manuals.