In the realm of industrial automation and control systems, proximity switch sensors stand as fundamental components, enabling non-contact detection of objects. This article provides a comprehensive visual guide, utilizing diagrams and images to elucidate their principles, types, and applications, tailored for electrical engineers and industry professionals.
Core Principle and Visual Representation
At its heart, a proximity sensor detects the presence or absence of a target object without physical contact. It does so by emitting an electromagnetic field, light beam, or ultrasonic waves. A change in this emitted signal, caused by the approaching target, is detected and converted into an electrical output signal. A basic block diagram typically illustrates this process: Oscillator → Sensing Coil/Element → Detector Circuit → Output Stage. An accompanying image of a standard inductive sensor cutaway reveals the internal coil wound around a ferrite core, housed within a robust metal or polymer casing.
Primary Types Illustrated
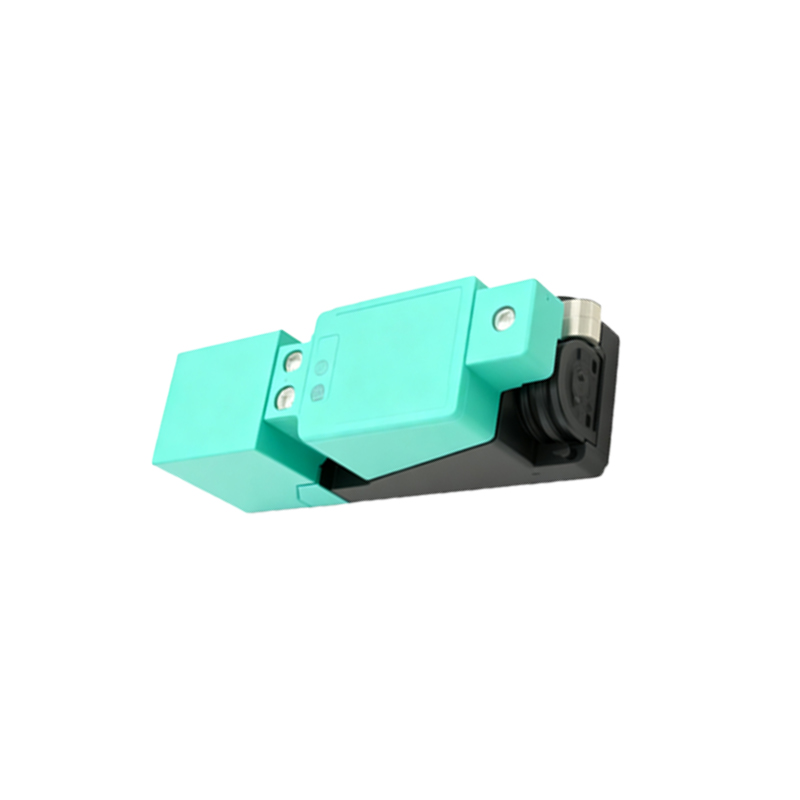
Understanding the different technologies is crucial for selection. Diagrams and photos help distinguish the key types:
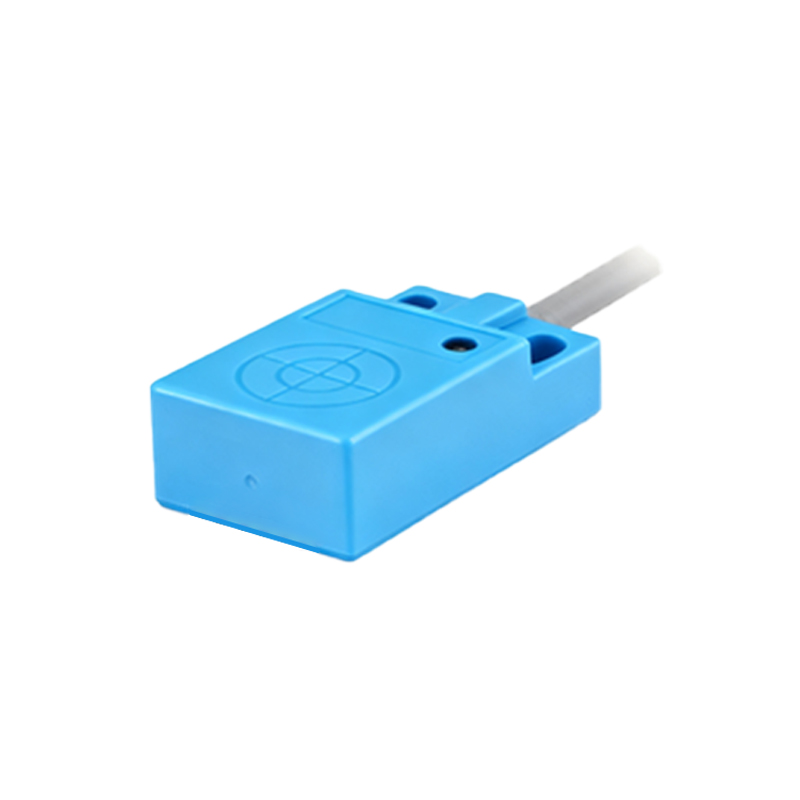
1. Inductive Proximity Sensors: These detect metallic objects, primarily ferrous metals like iron and steel. A diagram shows the electromagnetic field generated by the oscillator's coil. When a metal object enters this field, eddy currents are induced, causing a load on the oscillator. This change is detected, triggering the output switch. Images typically show cylindrical and rectangular housings in various sizes, often with an LED indicator. A performance graph plotting sensing distance versus target material (steel, aluminum, brass) is highly informative.
2. Capacitive Proximity Sensors: These can detect both metallic and non-metallic materials (plastics, wood, liquids, granules). A diagram illustrates how the sensor forms one plate of a capacitor, with the target object acting as the other plate. As the object approaches, the capacitance increases, altering the oscillator's amplitude and triggering the output. Photos often show sensors used for level detection in tanks or material handling.
3. Photoelectric Sensors: While often categorized separately, they operate on a proximity principle. A simplified diagram depicts the three main modes: Through-beam (separate emitter and receiver), Retro-reflective (target breaks the beam to a reflector), and Diffuse (sensor emits light and receives the reflection from the target itself). Images clearly show the different housing styles and lens types for these versatile sensors.
4. Ultrasonic Proximity Sensors: These use sound waves. A timing diagram is effective here, showing the emission of a sonic pulse and the reception of its echo. The time delay is calculated to determine distance. Photos show sensors used in challenging environments with dust or fog, where photoelectric sensors might fail.
Key Parameters in Datasheet Graphics
Selection relies on interpreting datasheet specifications, best understood with visual aids:
Sensing Distance (Sn): A diagram showing the nominal sensing distance for a standard target (e.g., a 1mm thick square of mild steel for inductive sensors). It clarifies the differences between nominal, effective, and guaranteed operating distances.
Hysteresis: A graph plotting distance versus output state visually explains the hysteresis zone, which prevents output chattering when a target is at the sensing edge.
Mounting Considerations: Diagrams are indispensable for showing flush-mountable (shielded) versus non-flush-mountable (non-shielded) inductive sensors, illustrating their respective field patterns and the necessary side-by-side mounting clearances to prevent interference.
Output Configuration: Standard IEC symbols (PNP vs. NPN, NO vs. NC) are best presented in clear circuit diagrams showing the load (e.g., a PLC input) connected to the sensor's output wire.
Application Images in Industry
Real-world images solidify understanding:
An image of an inductive sensor counting gear teeth on a rotating shaft.
A capacitive sensor monitoring fluid level inside a translucent tank.
A photoelectric sensor ensuring correct packaging position on a conveyor line.
An array of proximity sensors on an automated machine tool, highlighting their role in position verification.
Wiring Diagrams and Connections
A clear, color-coded wiring diagram is essential. It typically shows a DC 3-wire sensor (Brown: +V, Blue: 0V, Black: Output) connected to a PLC digital input module. Another diagram might show a 2-wire AC sensor connected in series with a load. These visuals prevent costly wiring errors.
In conclusion, proximity switch sensors are versatile workhorses of automation. By leveraging diagrams that explain theory, images that identify hardware, and graphs that define performance, engineers can make informed selection and integration decisions. Proper interpretation of these visual tools ensures reliable sensor operation, contributing to robust and efficient control system design. Always consult the manufacturer's specific documentation, as internal designs and performance