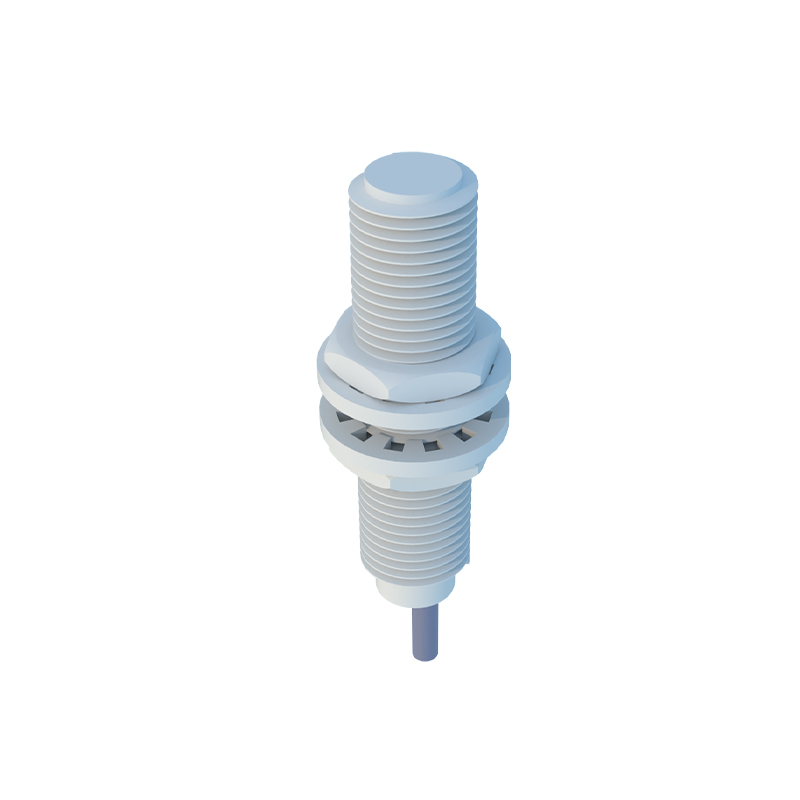
Proximity sensors are integral components in modern industrial automation, providing non-contact detection of metallic or non-metallic objects. Understanding the waveform output of these sensors is crucial for troubleshooting, performance optimization, and ensuring system reliability. This guide delves into the analysis of proximity sensor waveforms, examining key characteristics, common anomalies, and their implications in real-world applications.
A typical proximity sensor outputs a digital or analog signal, often visualized on an oscilloscope. The ideal digital output waveform for a standard inductive or capacitive sensor is a clean, square wave. When a target enters the sensing range, the output voltage should transition sharply from a high state (e.g., 24V DC) to a low state (0V), or vice-versa, depending on the sensor's configuration (normally open or normally closed). The rise time and fall time of this transition are critical parameters. A fast, clean edge indicates a healthy sensor with good switching characteristics. Excessive rise/fall times can signal issues like insufficient supply voltage, target material inconsistencies, or sensor degradation.
For analog output sensors, the waveform is a continuous voltage or current signal proportional to the distance to the target. Analyzing this waveform involves checking for linearity, smoothness, and signal-to-noise ratio. A clean, linear ramp as the target approaches signifies proper operation. Noise, spikes, or non-linearity in the analog waveform can point to electrical interference, improper grounding, mechanical vibration affecting the target, or a failing sensor element. In high-speed applications, such as counting or speed sensing, the consistency of the pulse waveform's frequency and duty cycle is paramount. Jitter or irregular pulse periods can lead to inaccurate measurements and system errors.
Common waveform anomalies provide diagnostic clues. A waveform with rounded edges or a sloping transition often suggests a weak sensor, a target at the extreme limit of the sensing range, or power supply issues. Oscillations or ringing on the top or bottom of the square wave are typically caused by electromagnetic interference (EMI), long, unshielded cable runs, or improper termination. Complete signal dropout indicates a wiring fault, a failed sensor, or a target outside the effective sensing distance. In analog waveforms, sudden signal drops or erratic fluctuations may indicate intermittent connections or severe environmental contamination affecting the sensing field.
Environmental factors significantly influence waveform integrity. Temperature extremes can cause signal drift, visible as a shifting baseline in analog outputs or altered switching points in digital sensors. The presence of other metallic objects in the vicinity can cause shielding effects or false triggering, manifesting as extra pulses or unstable signal levels. For capacitive sensors, changes in humidity or the presence of contaminants like oil or dust can alter the dielectric constant, leading to distorted waveforms and unreliable detection.
Effective waveform analysis requires a systematic approach. First, establish a baseline waveform under known good conditions with a standard target. Use a calibrated oscilloscope with appropriate bandwidth. Probe the sensor's output directly at its terminals to avoid noise introduced by the control system. Compare the live waveform against the baseline, paying close attention to transition sharpness, amplitude stability, and the presence of noise. Documenting waveforms during routine maintenance creates a valuable historical record for predictive maintenance strategies.
In conclusion, mastering proximity sensor waveform analysis is a powerful skill for engineers. It transforms reactive troubleshooting into proactive system management. By interpreting the visual language of these signals, engineers can pinpoint issues rapidly, from simple wiring faults to complex EMI problems, ensuring minimal downtime and maximizing the efficiency and longevity of automated systems. Regular waveform checks should be incorporated into preventive maintenance schedules to foster robust and reliable industrial operations.