In the realm of precision measurement and industrial automation, laser sensors stand as a cornerstone technology. Their ability to deliver non-contact, high-accuracy measurements of distance, displacement, and vibration is unparalleled. However, a critical parameter that fundamentally dictates their performance in dynamic applications is their frequency response. This article delves into the technical intricacies of laser sensor frequency response, explaining its significance, determining factors, and implications for system design.
What is Frequency Response?
In simple terms, the frequency response of a laser sensor describes how its output signal behaves when the measured target is moving or vibrating at different frequencies. It is a measure of the sensor's ability to accurately track rapid changes in position. Typically expressed in Hertz (Hz), it indicates the maximum frequency of target motion that the sensor can follow while maintaining specified accuracy. A sensor with a high-frequency response (e.g., 100 kHz) can capture very fast movements, while one with a low response (e.g., 100 Hz) is suitable only for slow or static measurements.
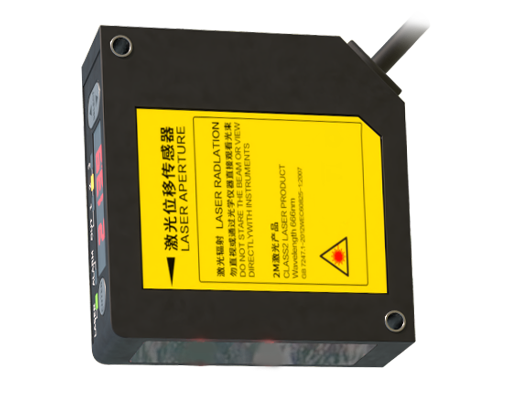
The Physics Behind the Limitation
The frequency response is not an arbitrary specification; it is intrinsically limited by the sensor's internal components and measurement principle. For triangulation-based laser sensors, the limiting factor is often the speed of the position-sensitive detector (PSD) or CMOS/CCD array and the associated signal processing electronics. The time it takes for the light spot to be detected, converted to a digital signal, and processed into a distance value creates a finite bandwidth.
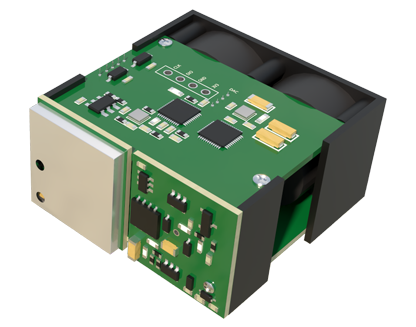
For interferometric or time-of-flight sensors, the limitations may stem from the modulation frequency of the laser beam or the sampling rate of the electronic circuitry. Furthermore, the sensor's internal electronic filters play a crucial role. These filters are designed to reduce noise but also attenuate high-frequency signal components, thereby shaping the frequency response curve.
Key Specifications: Bandwidth and Resonance

Two key specifications define the frequency response:
1. Bandwidth (-3 dB Point): This is the most common metric. It is the frequency at which the sensor's output signal amplitude falls to approximately 70.7% of its low-frequency value. Essentially, it marks the useful limit for accurate amplitude measurement. Operating near or beyond this point leads to increasing amplitude error.
2. Resonant Frequency: For sensors measuring vibration, the natural resonant frequency of the sensing element itself is critical. Exciting the sensor at or near its resonant frequency causes a large, often destructive, amplification of the output signal, rendering measurements invalid. Good sensor datasheets will clearly specify both the usable bandwidth and the resonant frequency.
Impact on Application Performance
Choosing a sensor with an inappropriate frequency response leads to measurement errors:
* Insufficient Bandwidth: If a target vibrates at 1 kHz but the sensor bandwidth is only 500 Hz, the sensor will fail to capture the true peak-to-peak displacement. The measured waveform will be distorted and attenuated, leading to an underestimation of vibration severity. This is critical in predictive maintenance, where accurate vibration analysis is essential.
* Aliasing: In digital systems, if the target motion contains frequency components higher than half the sensor's sampling rate (the Nyquist frequency), aliasing occurs. High-frequency signals appear as erroneous low-frequency signals in the data. Anti-aliasing filters within the sensor are designed to prevent this, and their cut-off is tied to the stated bandwidth.
* Phase Shift: Frequency response also involves phase linearity. A non-linear phase response across the bandwidth can distort the shape of a complex waveform, which is vital in applications like acoustics or modal analysis.
Factors Influencing Practical Frequency Response
The datasheet value is determined under ideal conditions. In practice, several factors can degrade it:
* Target Surface: Rough, dark, or transparent surfaces scatter or absorb laser light, reducing signal strength. A weak signal requires more averaging or filtering, effectively reducing the achievable bandwidth.
* Signal Conditioning: External amplifiers or filters added to the system will alter the overall system bandwidth. Their characteristics must be considered.
* Cable Length and Type: Long cables can introduce capacitance, potentially rolling off high-frequency signals, especially in analog output sensors.
Selecting the Right Sensor
To select a laser sensor based on frequency response:
1. Identify the highest frequency component in your target's motion. Use Fourier analysis on existing data if available.
2. Apply a safety factor. Choose a sensor with a bandwidth 5 to 10 times higher than your maximum frequency of interest to ensure minimal amplitude and phase distortion.
3. Consider the output type. Analog outputs (e.g., 0-10V) often have higher inherent bandwidths than digital serial communications (e.g., RS-422). However, high-speed digital interfaces like EtherCAT are closing this gap.
4. Review the complete datasheet curve. Look for a frequency response graph, not just a single number. It reveals the roll-off characteristics and resonance peaks.
In conclusion, the frequency response is a paramount specification that bridges the gap between a laser sensor's static accuracy and its dynamic performance. A deep understanding of this parameter enables engineers to make informed selections, ensuring that their measurement systems capture the true dynamics of the process, thereby enhancing quality control, predictive maintenance, and research outcomes. Ignoring it risks invisible measurement errors that can compromise an entire system's integrity.