Introduction to Photoelectric Sensor Systems
Photoelectric sensors are critical components in industrial automation, detecting objects, distances, and presence through light emission and reception. Their distribution across a system must be meticulously planned to ensure optimal coverage, minimal interference, and reliable performance. This guide provides a practical, diagram-based approach to understanding sensor placement, wiring, and calibration in common setups, such as conveyor belts, packaging lines, and robotic workcells.
Sensor Types and Their Distribution Patterns
There are three primary types: through-beam, retro-reflective, and diffuse sensors. Through-beam sensors require a separate emitter and receiver, ideal for long-range detection (up to 30 meters). Their distribution involves aligning the pair directly opposite each other, often at entry and exit points. Retro-reflective sensors combine emitter and receiver in one unit, using a reflector; distribution places them near reflective surfaces, typically 2–10 meters apart. Diffuse sensors rely on object reflection, with distribution focused on short-range (up to 1 meter) and angled positions to avoid background interference.
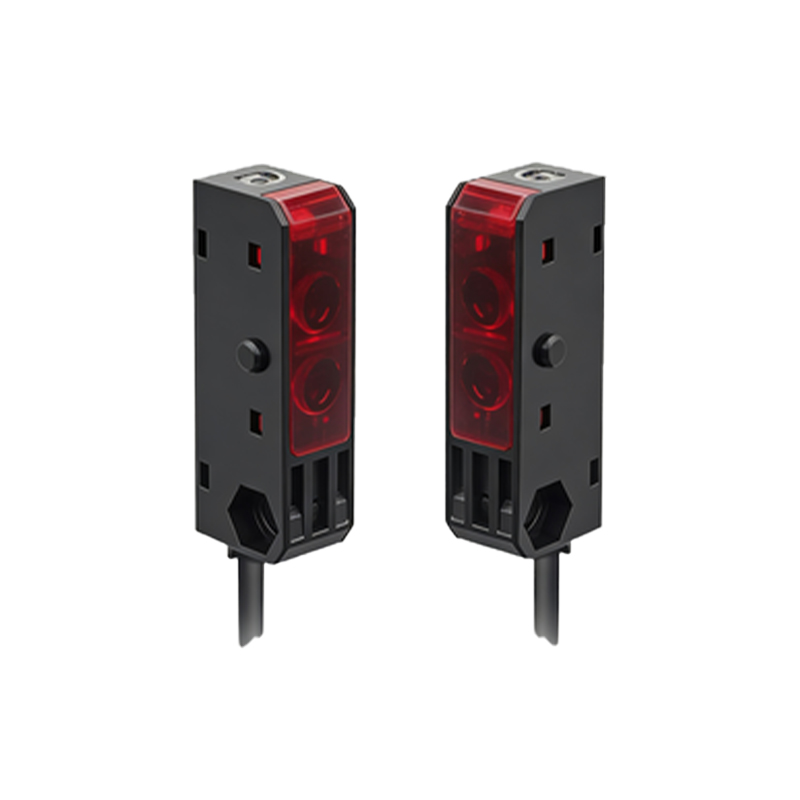
Diagram 1: Conveyor Belt Line Distribution
In a typical conveyor system, sensors are distributed at three key zones: the infeed, mid-section, and outfeed. At the infeed, a through-beam sensor pair is installed 0.5 meters from the belt start to detect incoming items. The mid-section uses two retro-reflective sensors, spaced 2 meters apart, to monitor product flow and spacing. At the outfeed, a diffuse sensor is mounted 15 cm above the belt to verify item exit. This distribution minimizes blind spots and ensures seamless operation.
Diagram 2: Packaging Machine Layout
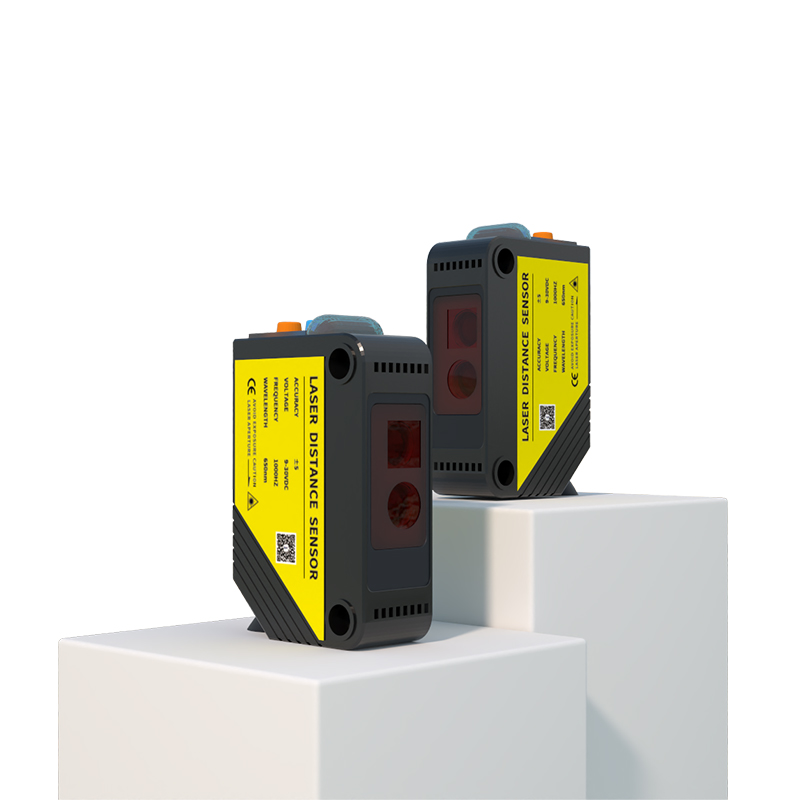
For a packaging machine, sensors are distributed around the wrapping and sealing modules. A retro-reflective sensor is placed 30 cm from the film roll to track film tension. Two diffuse sensors are angled at 45 degrees near the sealing jaw to detect product presence before sealing. At the discharge chute, a through-beam pair is installed 1 meter apart to count finished packages. This layout prevents jams and ensures accurate timing.
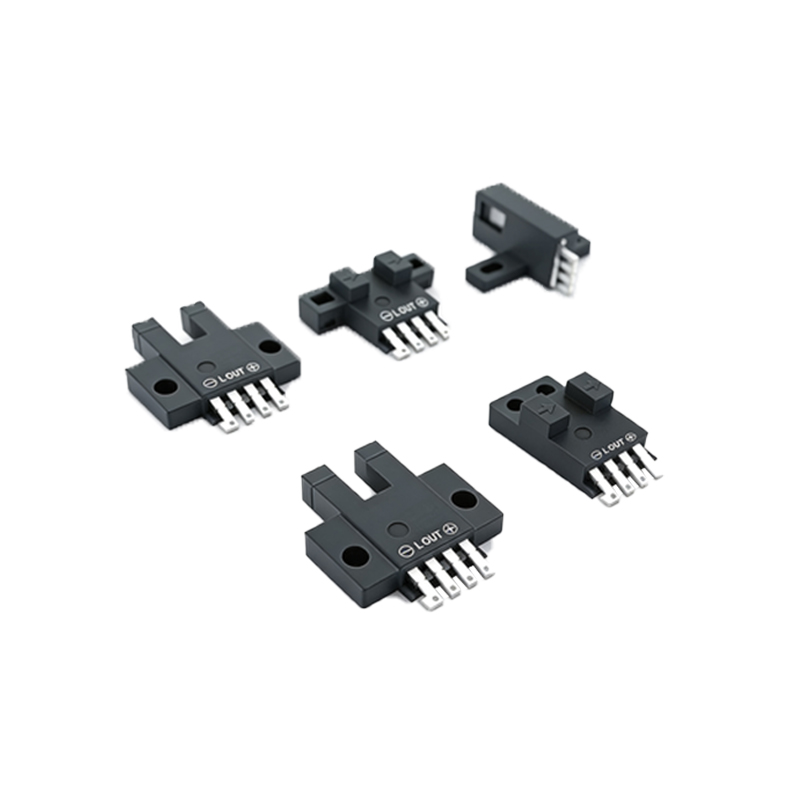
Diagram 3: Robotic Workcell Coordination
In a robotic workcell, sensors are distributed around the robot’s envelope for safety and precision. A diffuse sensor is mounted on the robot arm itself for proximity detection. Three retro-reflective sensors are placed at 120-degree intervals on the perimeter to create a safety zone. Additionally, a through-beam sensor pair is set at the entry gate to detect human intrusion. This distribution enables real-time adjustments and hazard prevention.
Wiring and Signal Distribution Strategies
Proper wiring is essential. Sensors should be connected via shielded cables to a central PLC using a star topology, with each sensor having a dedicated input. For distributed systems, use junction boxes with IP67 ratings to group sensors by zone. Signal distribution requires avoiding cable runs longer than 100 meters to prevent voltage drop. Use 24V DC power with redundancy for critical zones.
Calibration and Alignment Best Practices
After installation, calibrate each sensor using the teach-in function. For through-beam types, align the emitter and receiver using a laser pointer until the indicator light is steady. Retro-reflective sensors need reflective tape cleaned and angle adjusted to within 5 degrees. Diffuse sensors require a dark background test to set sensitivity. Document all settings in a diagram for future maintenance.
Common Distribution Mistakes and Fixes
A frequent error is placing sensors too close to reflective surfaces, causing false triggers. Solution: increase distance or use polarization filters. Another mistake is overlapping detection zones in tight spaces; adjust sensor angles by 10–15 degrees to avoid crosstalk. Also, avoid mounting sensors near vibration sources without dampeners. Regular diagram reviews can catch these issues early.
Conclusion: Enhancing System Reliability
By following these distribution diagrams and guidelines, engineers can achieve reliable photoelectric sensor performance. Regular updates to the diagram based on field data ensure long-term efficiency. Remember, a well-planned distribution reduces downtime and simplifies troubleshooting in any industrial setting.