In the realm of industrial automation and control systems, proximity sensors are indispensable components. Their primary function is to detect the presence or absence of an object without physical contact, relying on electromagnetic fields, light, or sound. A critical aspect of ensuring their reliable operation is understanding and monitoring their "normal average value." This term does not refer to a single universal figure but rather to a stable, expected output signal or parameter range under specified, nominal operating conditions. This baseline is fundamental for diagnostics, calibration, and system integrity.
The concept of a normal average value is intrinsically linked to the sensor's type. Inductive proximity sensors, which detect metallic objects, have a rated operating distance (Sn). Under ideal conditions—with a standard target (often a square of mild steel) at a specified temperature—the sensor should consistently switch output when the target reaches this Sn distance. The normal average here is this repeatable switching point. For instance, an 8mm sensor should reliably detect at 8mm. However, environmental factors like temperature drift or different target materials (e.g., aluminum, copper) will cause the actual switching point to vary from the nominal Sn. Therefore, the "normal" operational average in a real application might be 7.5mm for aluminum, establishing a new, stable baseline for that specific setup.
Capacitive sensors, used for non-metallic materials, exhibit a normal average value related to the dielectric constant of the target material and the sensitivity setting. Their output in a stable state, when detecting a specific material at a consistent distance and humidity level, represents its normal operational average. Photoelectric sensors have a normal average value tied to the received light intensity. In a clear, uncontaminated environment with a properly aligned reflector or opposed emitter, the received signal will sit at a stable high or low level (depending on wiring). This stable level is its normal average. Any significant deviation, such as a gradual decline due to lens fouling, signals a drift from normalcy.
Establishing what is "normal" requires an initial reference measurement during commissioning. Technicians should record the sensor's output signal (e.g., voltage, current, or digital state) or the precise detection distance under controlled, optimal conditions. This recorded value becomes the benchmark average. For analog sensors providing a 4-20mA or 0-10V output, the normal average value corresponds to the specific signal level when the target is at the desired control distance. For example, a target at 50mm might yield a steady 12mA, which is then the normal average for that application point.
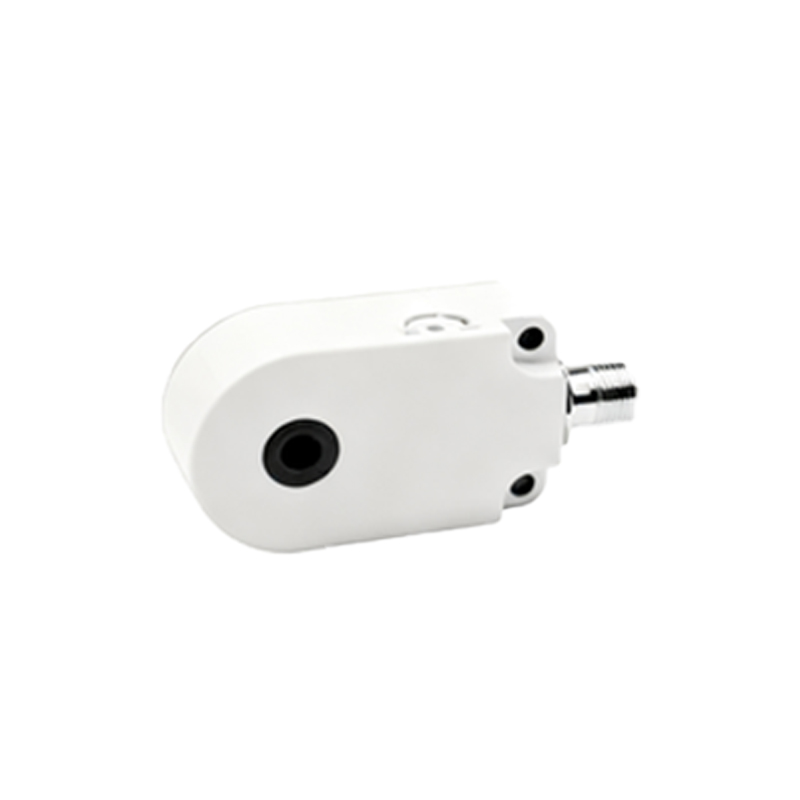
Several factors can cause the sensor's performance to deviate from its established normal average. Temperature extremes can affect electronic components and oscillation circuits, leading to signal drift. Voltage supply fluctuations can alter the sensor's characteristics. Accumulation of dust, oil, or debris on the sensing face directly impacts inductive, capacitive, and optical performance. Mechanical misalignment, especially for photoelectric sensors, will drastically change the received signal. Even variations in the target object—its size, material composition, or surface finish—can shift the detection point. Regular monitoring against the benchmark average helps identify these issues early.
In practice, leveraging the normal average value is key for predictive maintenance. Instead of waiting for a complete failure, monitoring trends is crucial. If an inductive sensor's effective sensing distance for a standard target gradually decreases from its recorded average of 8.0mm to 7.0mm over months, it may indicate aging internal components or buildup. A photoelectric sensor's signal strength dropping from 90% to 70% of its benchmark suggests lens contamination. Systematic logging of sensor outputs allows for maintenance scheduling before a fault causes downtime. Calibration procedures also rely on this concept; sensors are adjusted until their output matches the expected normal average under test conditions.
In conclusion, the "normal average value" for a proximity sensor is a dynamic, application-specific benchmark of stable performance. It is not a generic datasheet number but a carefully established reference point under controlled real-world conditions. Understanding, recording, and routinely comparing current sensor performance against this baseline is a hallmark of sophisticated industrial maintenance. It transforms proximity sensors from simple binary switches into valuable sources of diagnostic data, enabling higher system reliability, reduced unplanned stoppages, and optimized operational efficiency. Engineers and technicians must prioritize this practice to ensure the seamless functioning of automated systems where these sensors play a critical role.