In modern industrial automation and machinery design, proximity sensors play a critical role in non-contact object detection. Among the various form factors available, square proximity sensors are widely utilized for their robust housing and ease of installation. A square proximity sensor diagram is not merely a technical drawing; it is a fundamental blueprint that conveys essential information about the sensor's functionality, wiring, dimensions, and integration into a larger system. This article delves into the key components typically found in such diagrams and explains how to interpret them for effective implementation.
A standard square proximity sensor diagram will first illustrate the physical housing. The square or rectangular shape is clearly depicted, often with key dimensional data. This includes the sensor's length, width, and height, usually denoted in millimeters. Crucially, the diagram will specify the sensing face—the area from which the sensor emits its detection field (inductive, capacitive, or photoelectric). For inductive sensors, which detect metallic objects, this face is a critical reference point. Mounting holes or slots are also shown, with precise measurements for center distances, enabling engineers to design accurate mounting brackets or panels.
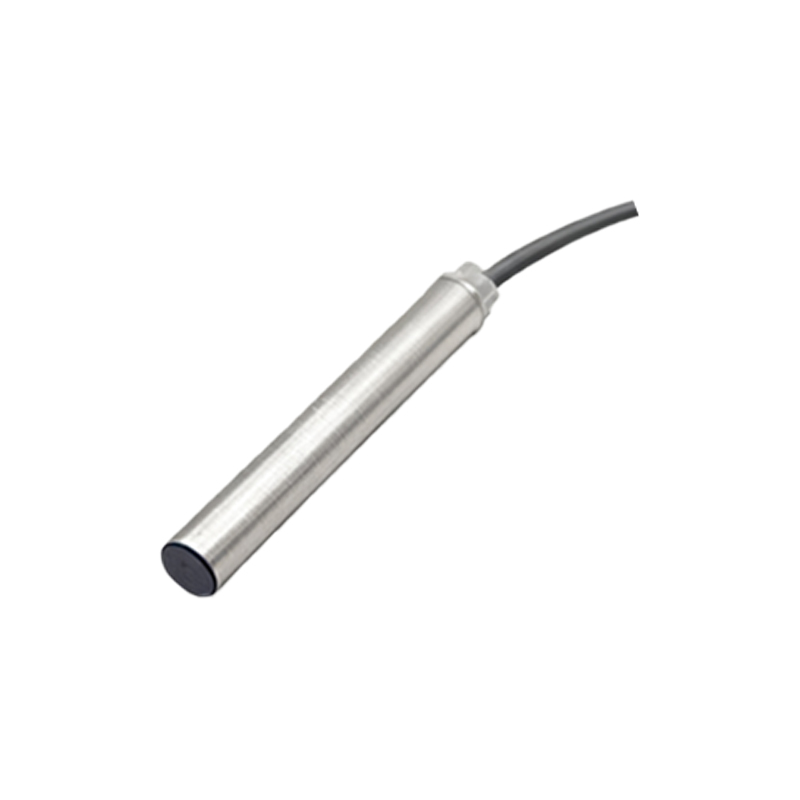
The electrical connection section is the heart of the diagram. Most industrial square proximity sensors have a pre-attached cable or a connector interface. The wiring diagram uses standardized symbols and color codes. For a common 3-wire DC sensor, the diagram will label the wires: brown for positive supply voltage (V+), blue for negative/common (0V), and black for the switched output signal. The diagram explicitly shows the load (e.g., a PLC input, relay, or indicator lamp) connected between the black wire and the positive or negative rail, depending on whether the sensor is configured as a sinking (NPN) or sourcing (PNP) type. Misinterpreting this part can lead to incorrect wiring and sensor failure.
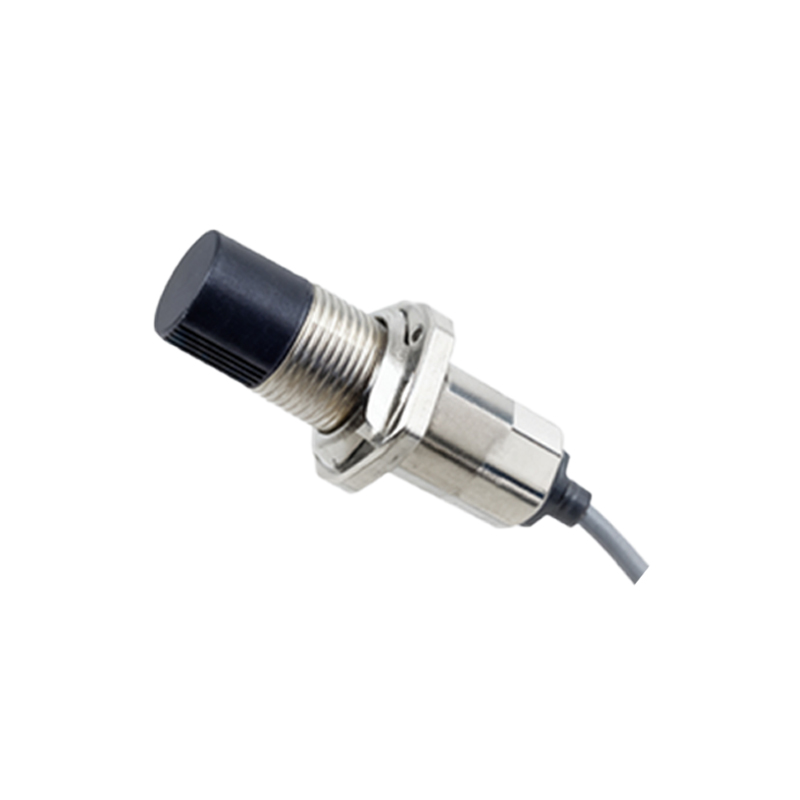
Furthermore, detailed diagrams include graphical representations of the sensor's output state relative to the target's position. A timing diagram or a simple state chart might show that the output transistor switches "ON" (conducts) when a target enters the specified sensing range and switches "OFF" when the target leaves. This visual aid clarifies the sensor's logic—normally open (NO) or normally closed (NC)—which is vital for programming machine control sequences.
Another essential element is the depiction of the sensing range and field characteristics. Diagrams often include side-view illustrations with dashed lines or cones showing the effective detection zone. For square inductive sensors, this zone is typically a short range directly in front of the sensing face. The diagram will note the rated operating distance (e.g., 5mm, 10mm), often labeled as "Sn." It may also show recommended installation clearances, indicating how much metal-free space is needed around the sensor to prevent false triggers from the mounting surface itself—a concept known as flush or non-flush mounting.
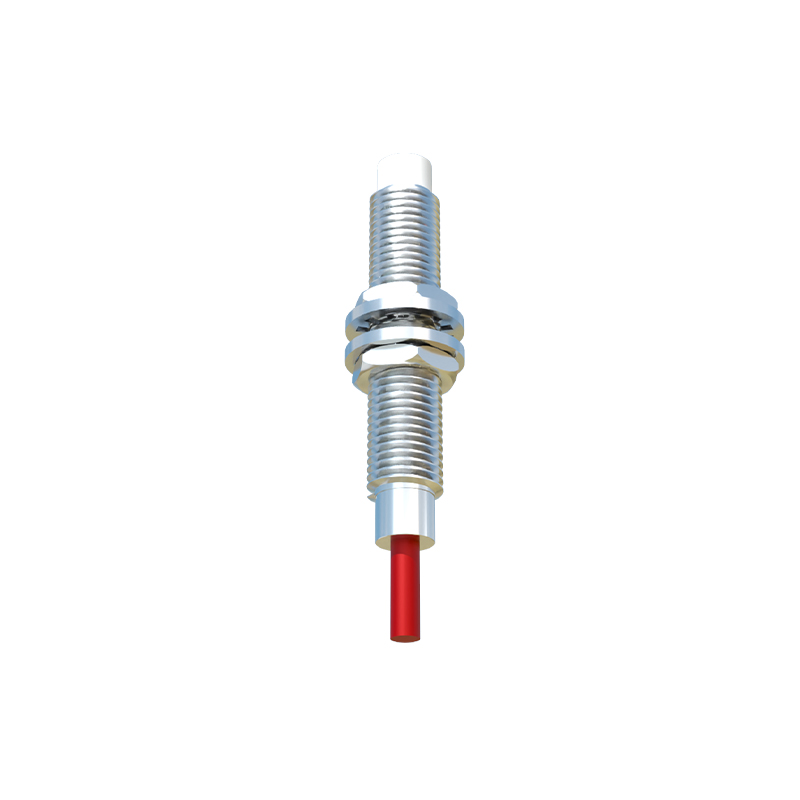
Additional technical markings on the diagram include the operating voltage range (e.g., 10-30V DC), current consumption, output current capacity, switching frequency, and protection ratings like IP67 (ingress protection against dust and water). LED indicator locations are also marked, showing where the status light is visible, aiding in troubleshooting.
Understanding these diagrams is paramount for system integrators, maintenance technicians, and design engineers. It ensures correct sensor selection for the application—whether it's detecting a metal gear tooth, counting packages on a conveyor, or confirming the position of a robotic arm. A proper interpretation prevents downtime, avoids electrical mishaps, and guarantees that the automated process operates reliably. Always cross-reference the diagram with the sensor's official datasheet for the most accurate and application-specific details. By mastering the square proximity sensor diagram, professionals can unlock greater efficiency and precision in their industrial control systems.