Proximity switch sensors are fundamental components in modern industrial automation, offering non-contact detection of metallic and, in some cases, non-metallic objects. Their reliability, long operational life, and high-speed response make them indispensable in applications ranging from assembly line counting and position sensing to safety interlocks and machine control. Understanding their working principle is greatly enhanced through schematic diagrams, which visually decode the underlying technology.
At its core, a proximity sensor detects the presence or absence of a target object without physical contact. It does this by emitting an electromagnetic field or a beam of electromagnetic radiation (like infrared light), and then looking for changes in the field or return signal. The primary types are Inductive, Capacitive, and Photoelectric, with Inductive being the most common for metal detection.
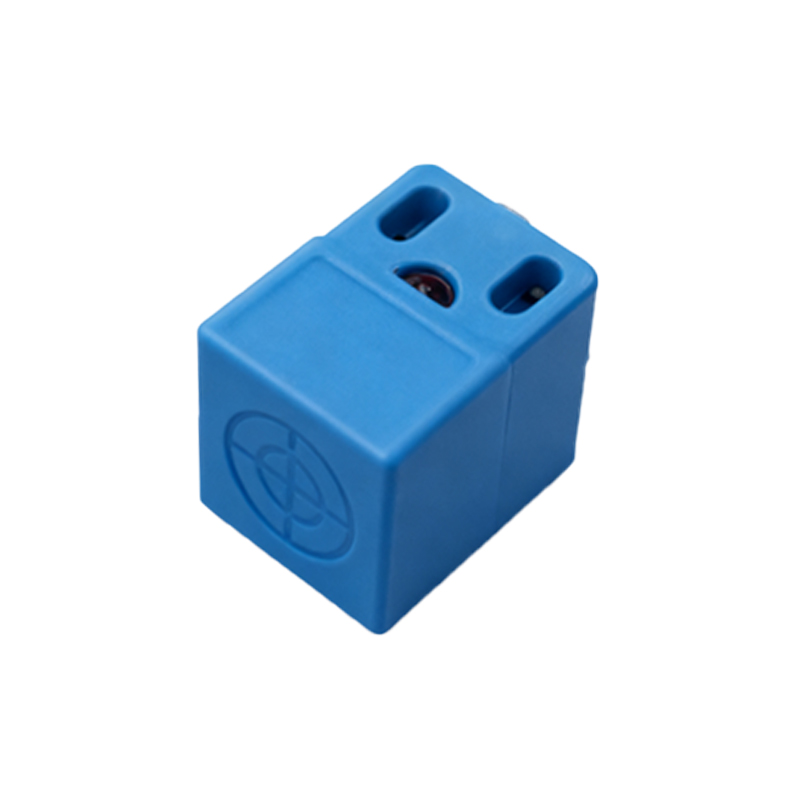
Inductive Proximity Sensors: The Workhorse for Metals
The principle diagram for an inductive proximity sensor typically shows four key internal components: an oscillator coil, a signal evaluator, an output switching circuit, and the sensor face. The oscillator generates a high-frequency alternating electromagnetic field that radiates from the sensor's active face. When a conductive metal target enters this field, eddy currents are induced on the surface of the target. These eddy currents draw energy from the oscillator, causing its amplitude to drop. The signal evaluation circuit detects this amplitude reduction and triggers the solid-state output switch (typically NPN or PNP transistor) to change state—turning ON or OFF. A diagram clearly illustrates the undisturbed field versus the disturbed field with the target present, showing the corresponding change in the oscillator waveform and the output signal. This principle makes them immune to non-metallic substances like dust, oil, or water.
Capacitive Proximity Sensors: Detecting Nearly Anything
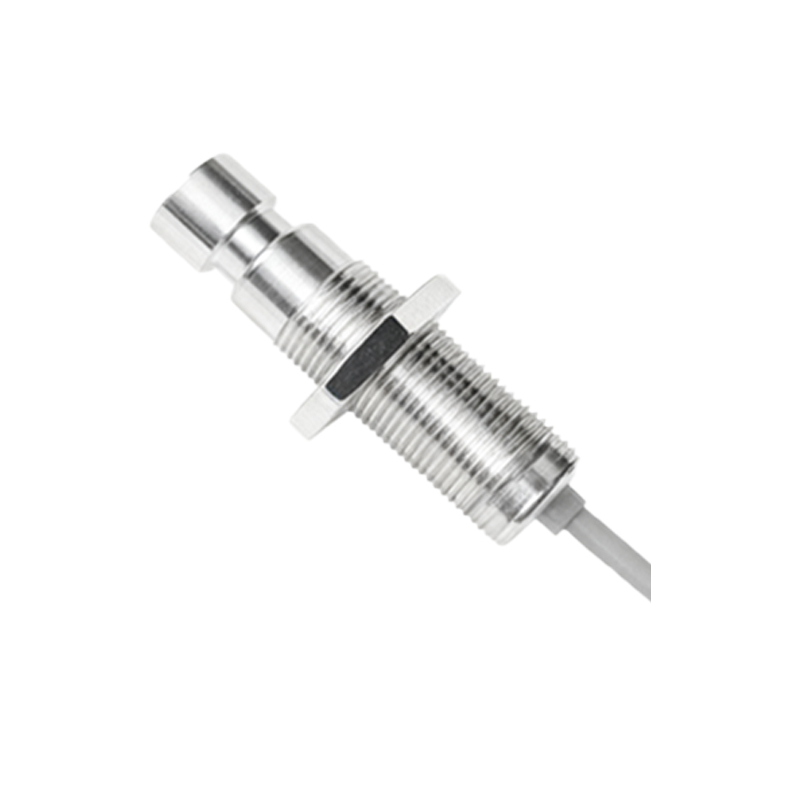
A capacitive sensor's diagram resembles an inductive one but with a critical difference: it functions like an open capacitor. The sensor face acts as one plate of a capacitor, the target object acts as the other plate, and the air gap is the dielectric. The internal oscillator circuit is tuned to the capacitance of this arrangement. When any object (metal, plastic, wood, liquid, powder) enters the sensing zone, it alters the dielectric constant and thus the capacitance of the system. This change in capacitance increases the oscillator's amplitude. The evaluation circuit detects this increase and switches the output. Diagrams often show the electric field lines extending from the sensor face to the target, visually explaining its ability to detect materials other than metal, even through non-metallic container walls.
Photoelectric Sensors: The Long-Range Option
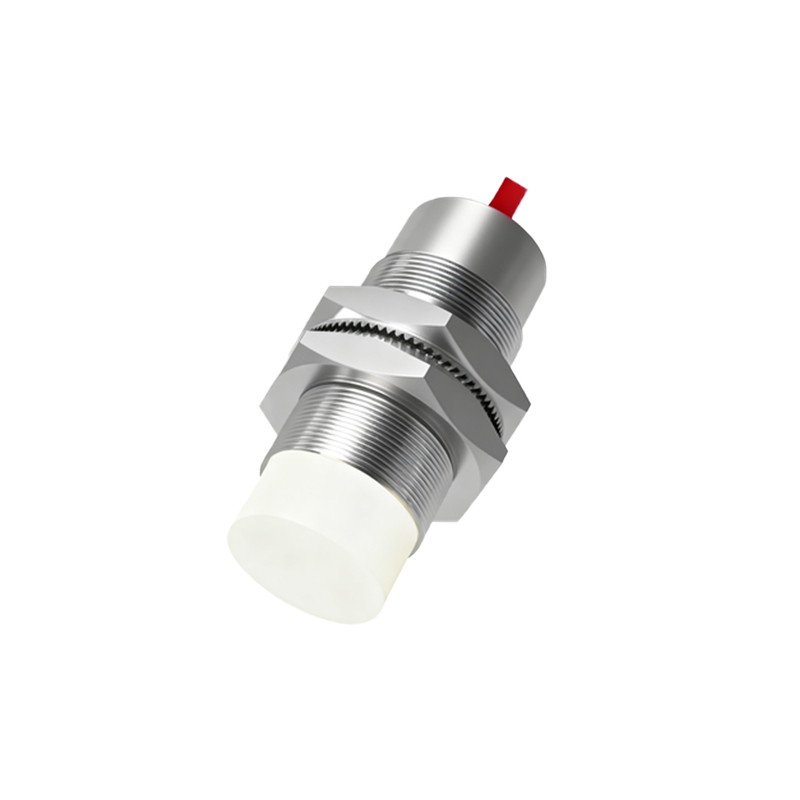
While not always classified under "proximity switches" in the strictest sense, photoelectric sensors are crucial for non-contact detection. Their principle diagrams are more varied, depicting the three main types: Through-beam, Retro-reflective, and Diffuse (proximity-mode). A Through-beam diagram shows a separate transmitter and receiver; breaking the light beam triggers the output. A Retro-reflective diagram shows a single unit emitting light to a reflector; the output triggers when the beam is blocked. Most relevant is the Diffuse (proximity) diagram: the sensor emits a light beam (usually infrared LED), and the receiver detects the light scattered back from the target object. The output switches when the reflected light intensity exceeds a threshold. These diagrams highlight components like the LED, phototransistor, and often a potentiometer symbol for sensitivity adjustment.
Interpreting Key Diagram Symbols
Standardized symbols in these diagrams convey critical information. The sensor housing is often shown as a rectangle or circle. The sensing field is depicted as dashed lines or a conical shape emanating from the face. Electrical connection points are labeled: typically +V (brown/red), 0V (blue/black), and Output (black/white). The output switching element (transistor) is shown inside, with its configuration (NPN sinking or PNP sourcing) clearly indicated by the direction of the emitter arrow. Many diagrams also include icons for the detectable target material (a metal piece for inductive, a generic block for capacitive).
Application Insights from Diagrams
Diagrams are not just theoretical; they inform practical application. For instance, a diagram showing the "standard sensing distance (Sn)" versus the "assured operating distance" teaches engineers about necessary safety margins. Diagrams illustrating the sensor's "hysteresis" property—a small difference between the switch-on and switch-off points—explain why sensors don't chatter when a target is at the exact sensing limit. Mounting diagrams show the importance of avoiding metal flush mounting for inductive sensors, as it can dampen the field, a concept easily grasped visually.
In conclusion, proximity switch sensor principle diagrams serve as the essential bridge between abstract electrical theory and robust real-world implementation. They empower engineers and technicians to select the correct sensor type—inductive for metals, capacitive for diverse materials, photoelectric