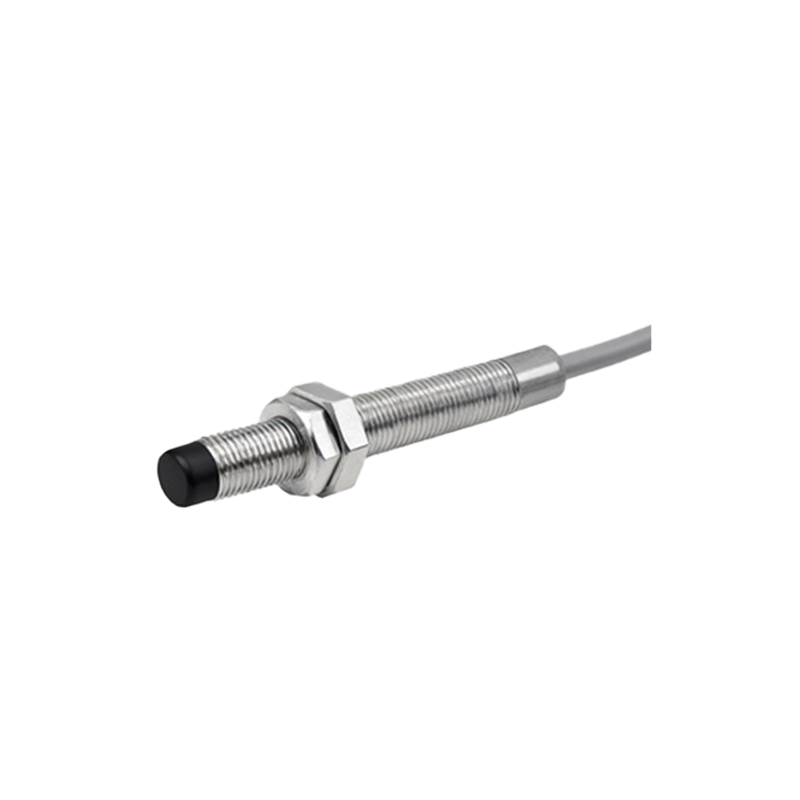
Proximity switch sensors are fundamental components in modern industrial automation, providing non-contact detection of metallic or non-metallic objects. Among various technical documents, the square diagram—often referred to as a functional block diagram or schematic representation—plays a critical role in illustrating the operational principles and wiring configurations of these sensors. This article delves into the structure, interpretation, and practical applications of square diagrams for proximity sensors, tailored for engineers and technicians in the electrical and automation fields.
A proximity switch sensor square diagram typically encapsulates key functional blocks within a rectangular format, outlining internal circuitry, signal processing paths, and output stages. Each block represents a specific module: the oscillator circuit generates a high-frequency electromagnetic field; the detection circuit monitors changes in amplitude or frequency caused by target presence; the trigger circuit processes these changes to activate the output; and the output stage (e.g., NPN, PNP, or analog) interfaces with controllers like PLCs or relays. The diagram simplifies complex interactions, enabling quick troubleshooting and integration. For instance, in a typical inductive proximity sensor diagram, the oscillator block connects to a coil, with damping indicators showing sensitivity adjustments.
Understanding these diagrams requires familiarity with standard symbols and notations. Common elements include power supply terminals (V+ and GND), output terminals (OUT), and status LEDs. Diagrams often incorporate timing charts or truth tables to depict response behaviors, such as switch-on/off delays or output logic (normally open/closed). Engineers rely on these visuals to verify compatibility with control systems—ensuring voltage ratings (10-30V DC or 20-250V AC) and output types (sinking vs. sourcing) align with application needs. In high-noise environments, diagrams may highlight shielding or filtering components to mitigate interference, a crucial detail for maintaining reliability in manufacturing or material handling setups.
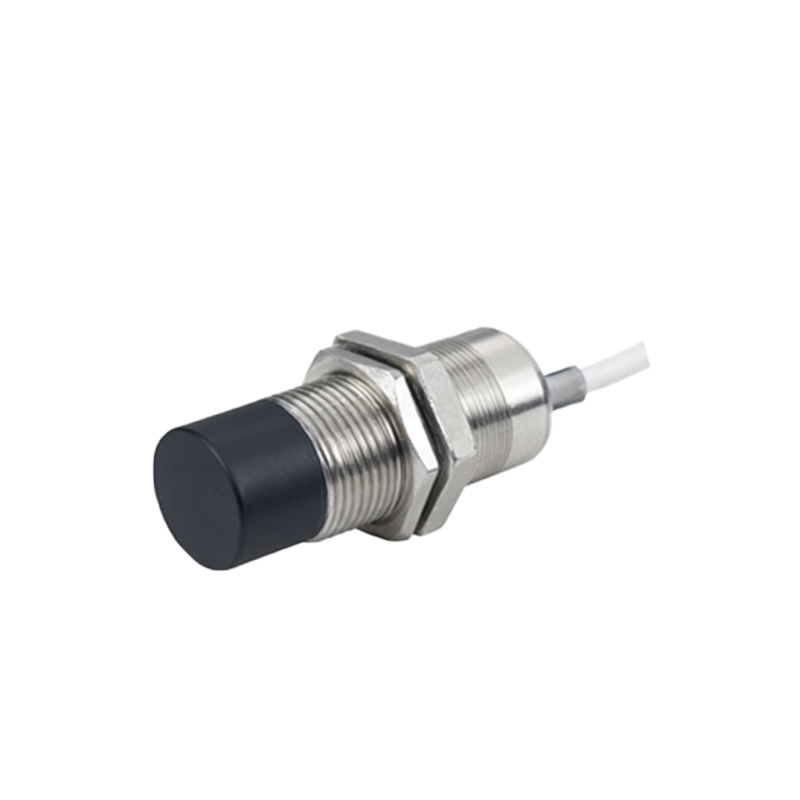
Practical applications of square diagrams span across industries. In conveyor systems, diagrams guide the installation of proximity sensors for object counting or position verification, with wiring layouts preventing short circuits. For automotive assembly lines, diagrams clarify how sensors interface with robotic arms, detailing fail-safe mechanisms like short-circuit protection. Maintenance teams use these references to diagnose faults—e.g., if a sensor fails to trigger, the diagram helps isolate issues in the oscillator or output stage. Additionally, diagrams aid in selecting sensors for harsh conditions, illustrating temperature or IP ratings within functional blocks.
Advancements in sensor technology have refined square diagrams to include digital communication interfaces (IO-Link, AS-Interface), where blocks represent data transmission modules. Modern diagrams may integrate diagnostic features, such as predictive maintenance alerts or parameterization options, enhancing smart factory implementations. Engineers should cross-reference diagrams with datasheets for specifications like sensing range, repeatability, and housing materials (e.g., stainless steel for washdown areas).
In summary, proximity switch sensor square diagrams serve as indispensable tools for design, installation, and troubleshooting. By mastering their interpretation, professionals can optimize automation systems for efficiency and safety, reducing downtime and ensuring seamless operations. As industries evolve toward Industry 4.0, these diagrams will continue to adapt, incorporating IoT capabilities and enhanced visualization for next-generation applications.