Proximity switch sensors are fundamental components in modern industrial automation and electrical control systems. As an electrical engineer, mastering the diagramming methods for these sensors is crucial for designing, installing, troubleshooting, and documenting systems effectively. This article delves into the standard practices and techniques for representing proximity switches in electrical schematics and wiring diagrams, adhering to international norms and industry conventions.
First and foremost, understanding the symbology is key. Proximity sensors, being non-contact devices that detect the presence or absence of an object, are represented by specific graphical symbols. The most common symbol resembles a diamond or a parallelogram with two parallel lines extending from it, representing the sensing face. This symbol is often accompanied by the type abbreviation (e.g., "PRX" for proximity, "IN" for inductive, "CA" for capacitive) placed adjacent to it. It is vital to note that the symbol does not typically differentiate between the sensor's physical housing and its sensing element; rather, it denotes the functional unit. The connection points, usually depicted as small circles or dots, indicate the wiring terminals for power supply, output signal, and, if applicable, a diagnostic or enable line.

The diagramming method extends beyond the mere symbol placement. A comprehensive diagram must clearly illustrate the sensor's integration into the circuit. This involves showing its power source, typically 10-30V DC for solid-state models, and its load, which could be a programmable logic controller (PLC) input module, a relay coil, or another control device. The standard practice is to draw the sensor's power lines (positive and negative/ground) from the power supply rail. The output line, which switches state (PNP-sourcing or NPN-sinking) upon detection, is then connected to the load. For a PNP sensor (sourcing current), the output is connected to the load, and the load's other terminal is connected to ground. Conversely, for an NPN sensor (sinking current), the load is connected to the positive supply, and the sensor output connects the load to ground when activated. Clear labeling of wire numbers, terminal designations (e.g., +V, 0V, OUT), and cable types is imperative for clarity.
Wiring diagrams, as opposed to pure schematics, provide a more physical representation. They show the actual connection points on terminal strips, sensor connectors, and control cabinet layouts. Here, the focus is on the practical routing of cables, wire colors (following standards like brown for +24V, blue for 0V, and black for the output signal), and shield grounding for analog or high-frequency sensors to prevent electromagnetic interference. A detailed wiring diagram will often include a legend explaining the color codes and a bill of materials listing part numbers for the sensors, connectors, and cables.
For complex systems with multiple sensors, a systematic numbering or tagging method is employed. Each sensor is assigned a unique identifier (e.g., PS101, PS102) that is consistent across all documentation—schematics, wiring diagrams, and parts lists. This tag is placed next to the symbol on the diagram. Furthermore, the diagram should indicate the sensor's nominal sensing distance and the target material it is designed to detect (e.g., steel, aluminum, plastic), as this affects its performance and wiring considerations, especially for inductive and capacitive types.
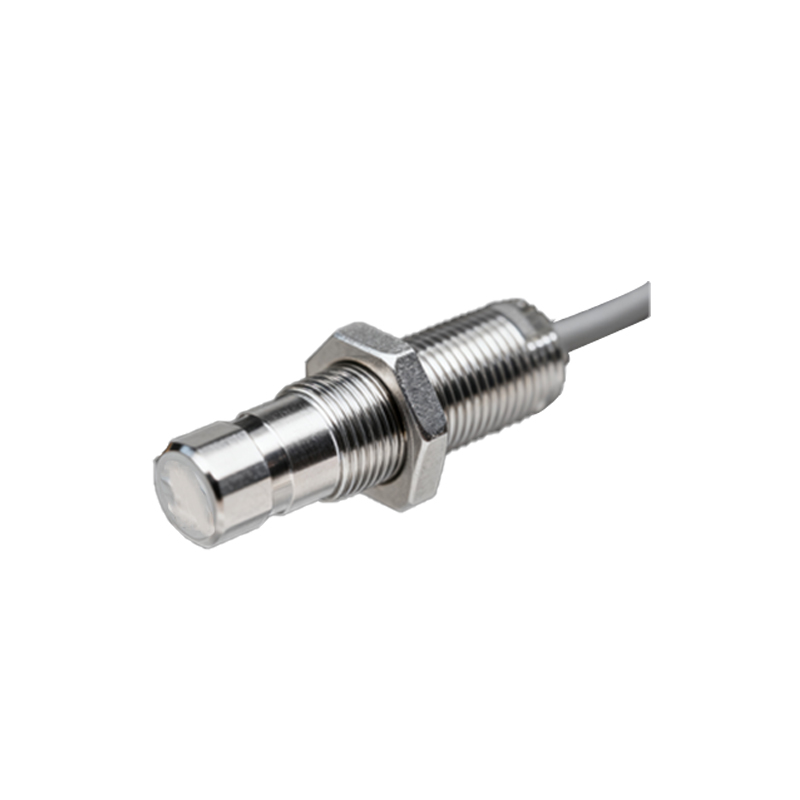
Another critical aspect is the depiction of diagnostic and configuration features. Modern intelligent proximity switches may have separate wires for diagnostic feedback (e.g., a short-circuit or open-circuit signal) or for configuring parameters via IO-Link or other fieldbus protocols. These additional connections must be clearly shown on the diagram, often using dashed lines or specific symbols to distinguish them from the main power and output lines. The protocol type and address, if applicable, should be noted.
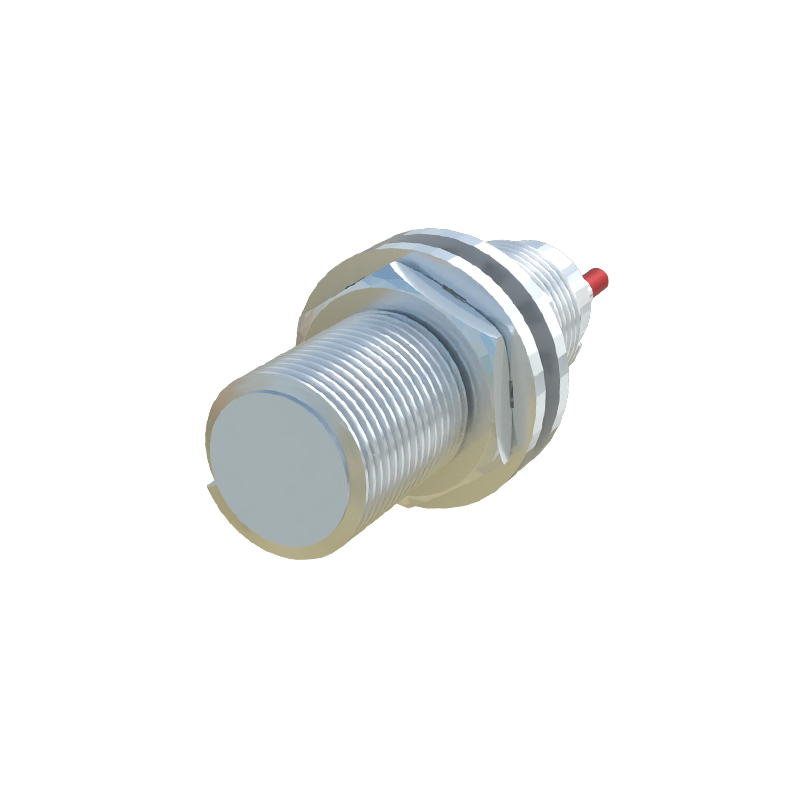
Finally, best practices in diagramming include maintaining consistency across all project drawings, using computer-aided design (CAD) software with standardized symbol libraries, and providing detailed notes for any non-standard configurations. Diagrams should be drawn with clear line work, avoiding clutter, and using different layers for power, signal, and communication lines. A well-drawn proximity sensor diagram is not just a technical drawing; it is a communication tool that ensures system reliability, simplifies maintenance, and facilitates knowledge transfer among engineering teams. By adhering to these methodical diagramming approaches, electrical engineers can create precise and actionable documentation that stands up to the rigors of industrial application.